Historical network analysis of a network malfunction
Why was the server unavailable at a certain time?

Why was the server unavailable at a certain time?
Network malfunctions often occur when you’re not sitting at the computer. But you can still investigate the cause of the error – for the Allegro Network Multimeter makes light work of a historical analysis of network traffic.
Suppose an employee tells you that they often have problems reaching a server, and that the problem last occurred today at about 10am.
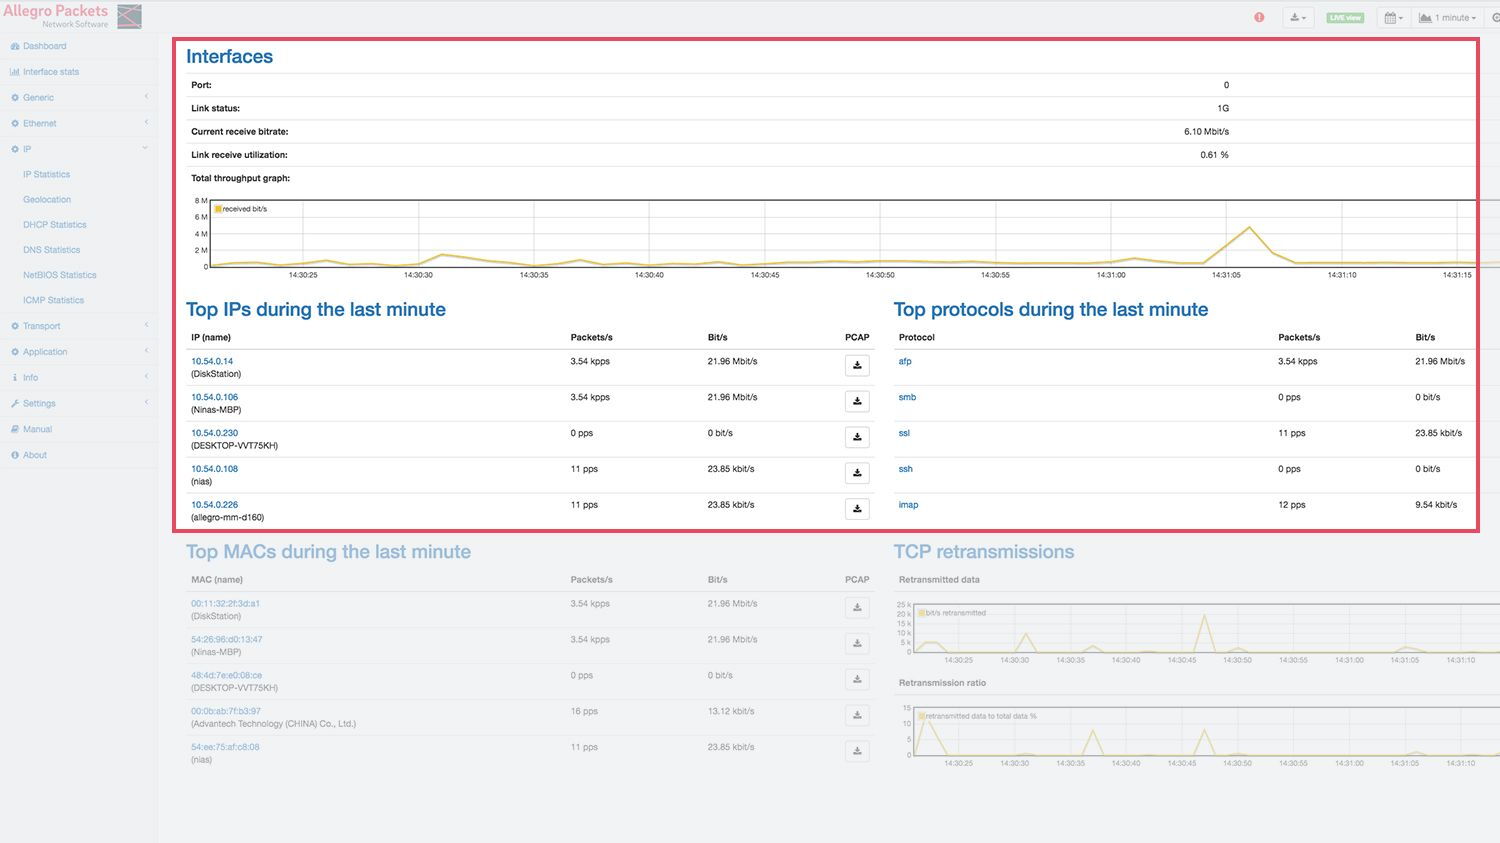
To carry out historical network analysis for this malfunction, the Allegro Network Multimeter has to be installed at a point passed by the employee’s packets on their way to the server. If this is already the case, open the dashboard of the Allegro Network Multimeter in the browser. In the upper section entitled ‘Interfaces’, the network traffic is shown in a graph, initially in real time. Change to the desired time interval by using the integrated calendar selection or the convenient zoom function in the graph, which can be controlled using the mouse wheel and the Ctrl key.
Once a specific time interval has been selected, all the statistics and lists displayed will refer to exactly this period in the recent past. (The time interval can be reset by clicking the reset button next to the calendar selection.)
Starting from this interval, you can now home in on past connections between the employee and the server. In the first step, identify the employee’s computer. To do so, click on ‘IP statistics’ in the menu on the left and search for the name of the employee’s PC or its IP address in the full-text search.
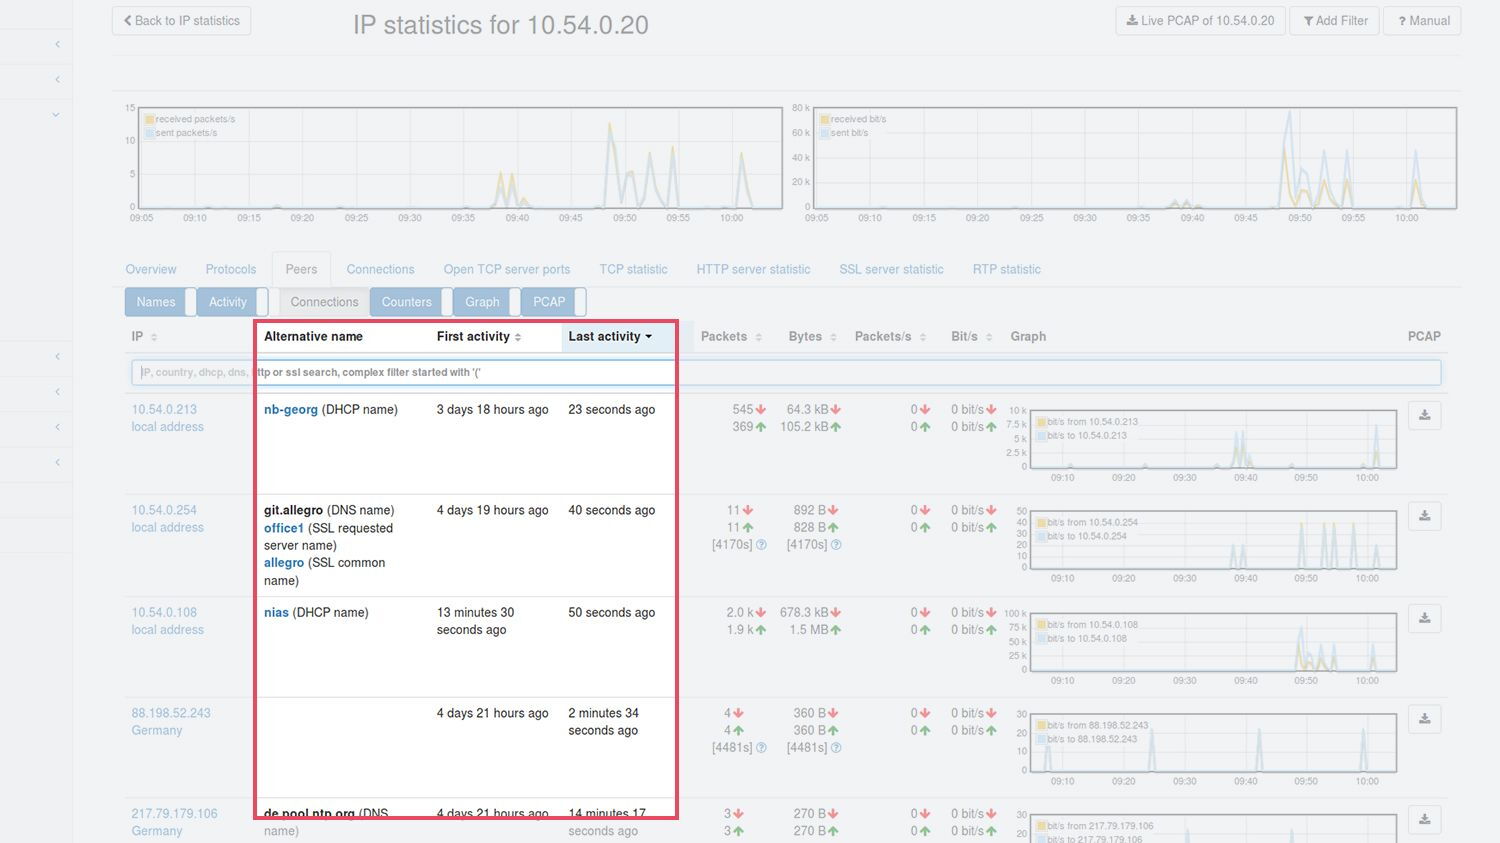
By clicking on the IP address found and on the ‘Peers’ tab, you’ll be shown all the connections that originated from this computer during the relevant period. Note that from 9.50am, no network traffic originated from this employee. Perhaps the network was down?
Advantages at a glance
- Immediate retroactive network analysis
- All connetions clearly shown
- Details of the choosen period
- Plug & Play
- Intuitive troubleshooting

Allegro Network Multimeter
Historical network analysis of individual PCs or servers
Can you see a connection to the server? Were packets sent and received? Were there many retransmissions? Click on the connections you want to examine more closely and extract a pcap if necessary.
If, during this historical network analysis, you discover that no connection was established with the server, there was probably a problem between it and the employee’s PC. To narrow down the cause of the faulty connection, examine the employee’s other connections during this period. What worked – and what didn’t? What were the response times of individual connections?
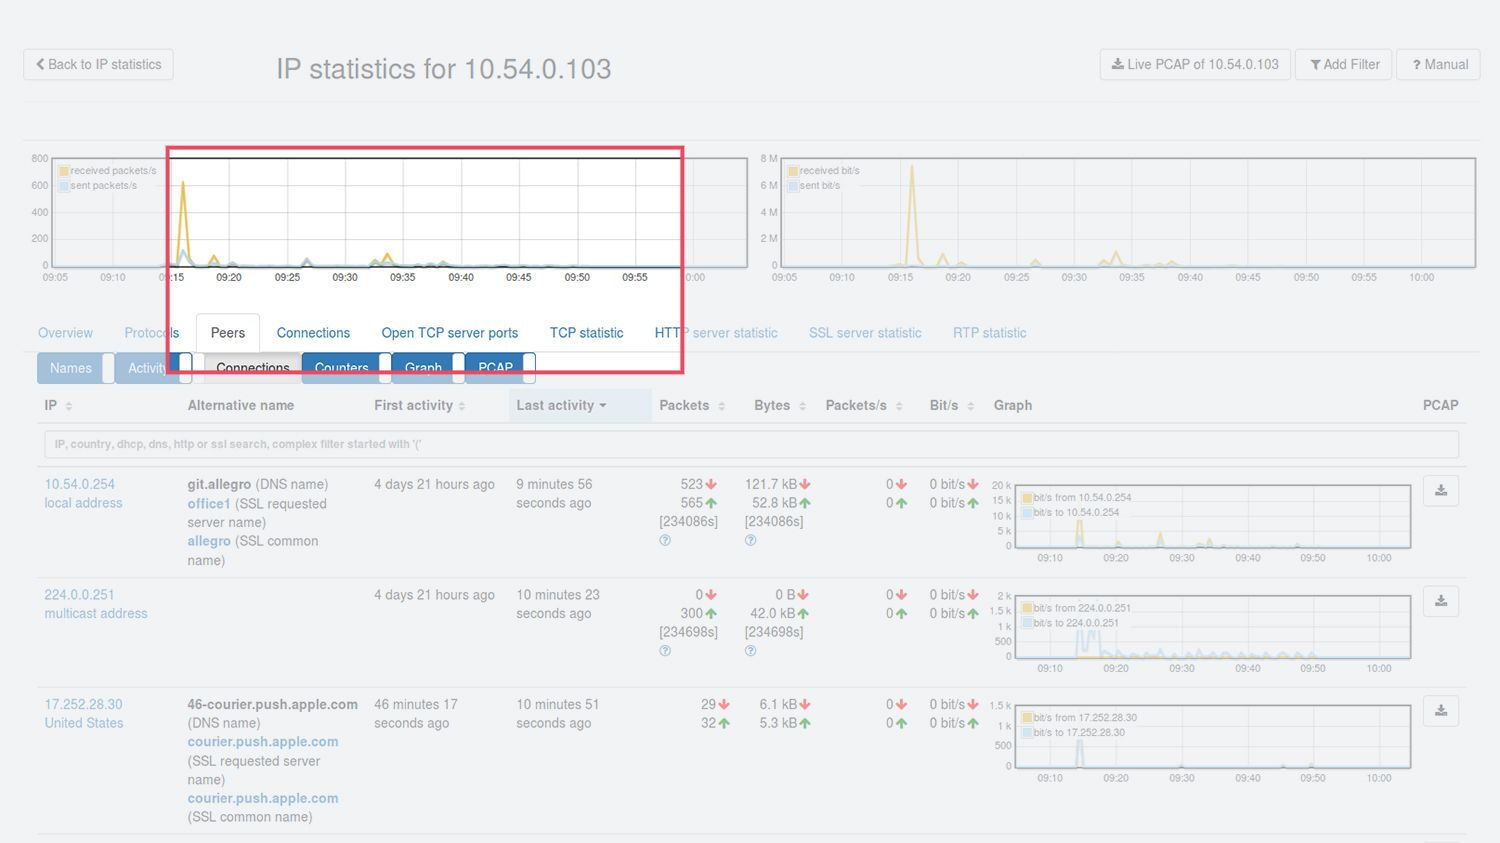
Another possible cause of error is the server itself. Using the Allegro Network Multimeter, you can continue your historical network analysis on the server. To do so, repeat the above analysis steps. Look for the server on the ‘IP statistics’ page using the full-text search. Once again, click on ‘Peers’ on the IP address found to display all the connections of the selected server. It can now be seen for instance that although the employee who reported the problem wasn’t able to access the server, some employees were. This reinforces the hunch that the server can be ruled out as a cause and that the problem must have been a network failure.
By continuing in this manner, you can increasingly narrow down the cause of the error and find out more about the cause of the malfunction.