Analysis of poor network performance based on top IP addresses
Why was the network so slow this morning?

After a long weekend, the system administrator receives several emails from colleagues complaining about the network being sluggish. Network performance suddenly collapsed on Monday morning between 10 and 10.30am. Why?
The cause can easily be found using the Allegro Network Multimeter.
If the multimeter is already installed at a point in the network, simply open the web interface in your browser. First of all, the dashboard is displayed. The current network traffic is shown in the graph at the top of the section called ‘Interfaces’. The sections below are dedicated to the ‘Top IPs’ and the ‘Top protocols’, i.e. a display showing which users and which protocols caused the most network traffic in the past minute.
Enter the desired time interval either by using the integrated calendar selection or the zoom function in the graphs. In the selected time window, very high utilization can now be seen in the graph.
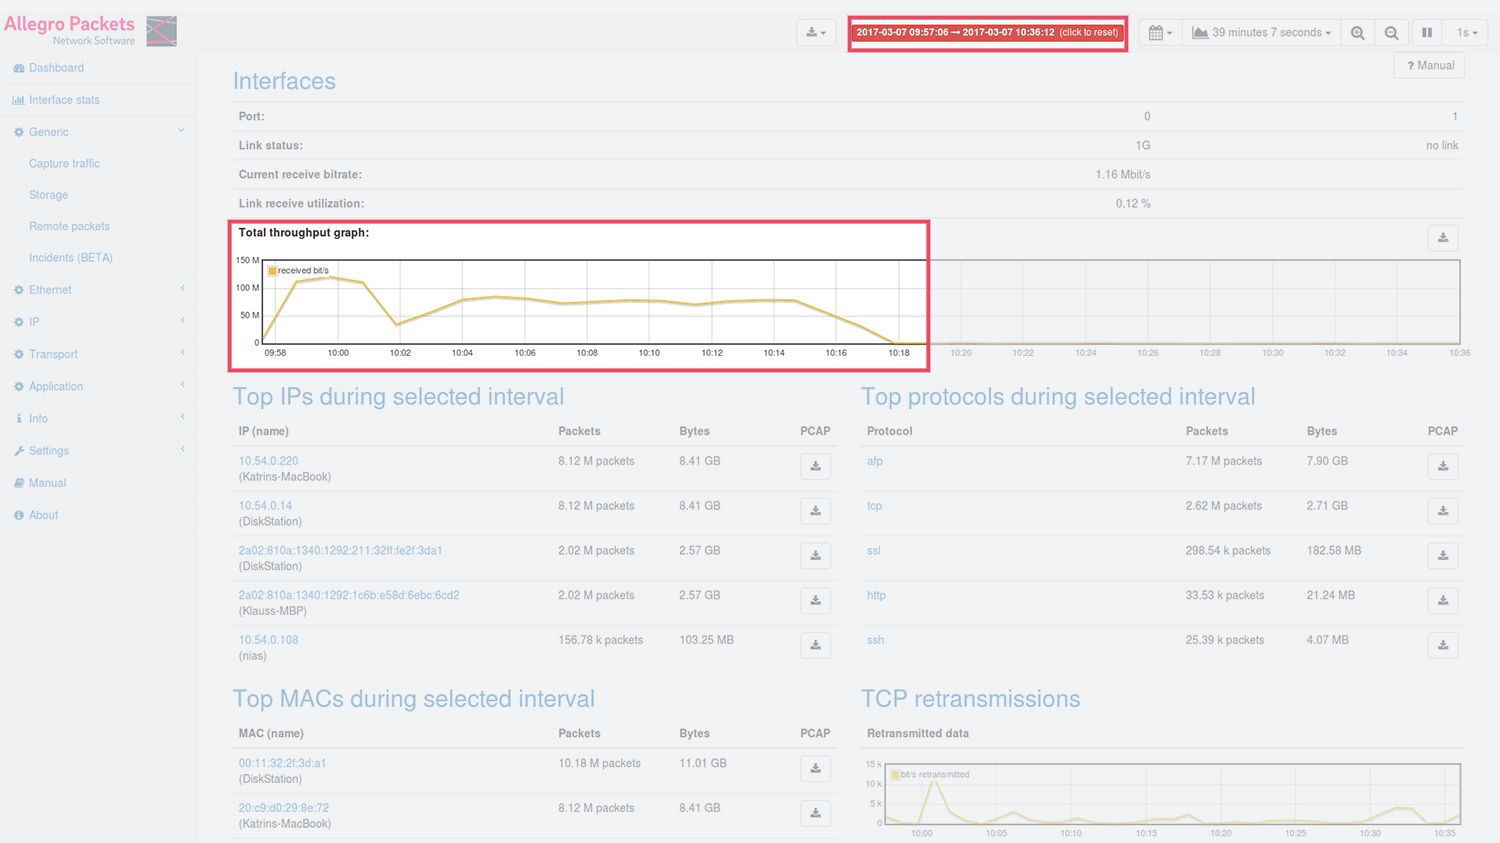
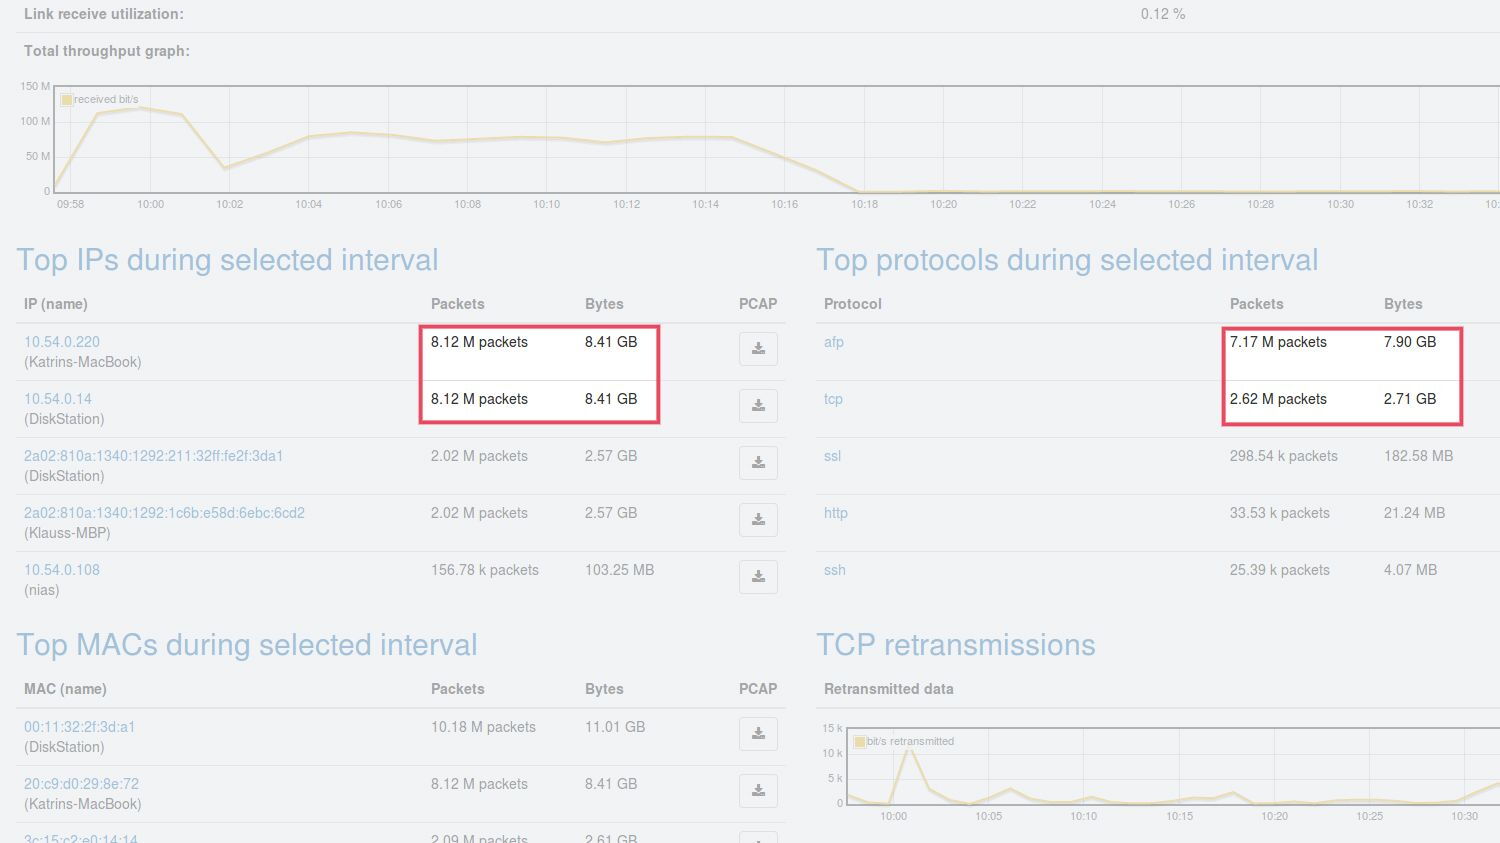
Instead of the most active IP addresses and protocols with the highest traffic in the past minute, the lists ‘Top IPs’ and ‘Top protocols’ now show (as their names suggest) the top IP addresses and the top protocols in the selected period. Note that one IP address and one protocol caused almost all the traffic in this interval. It is hence already evident that a specific user was responsible for an enormous amount of network traffic in this period.
Your advantages at a glance
- Top IPs at a glance
- All statistics of a selected period
- Desired time interval easily selected
- Detailed display to all information concerning top IPs
- Intuitive application

Allegro Network Multimeter
Details on the top IP address
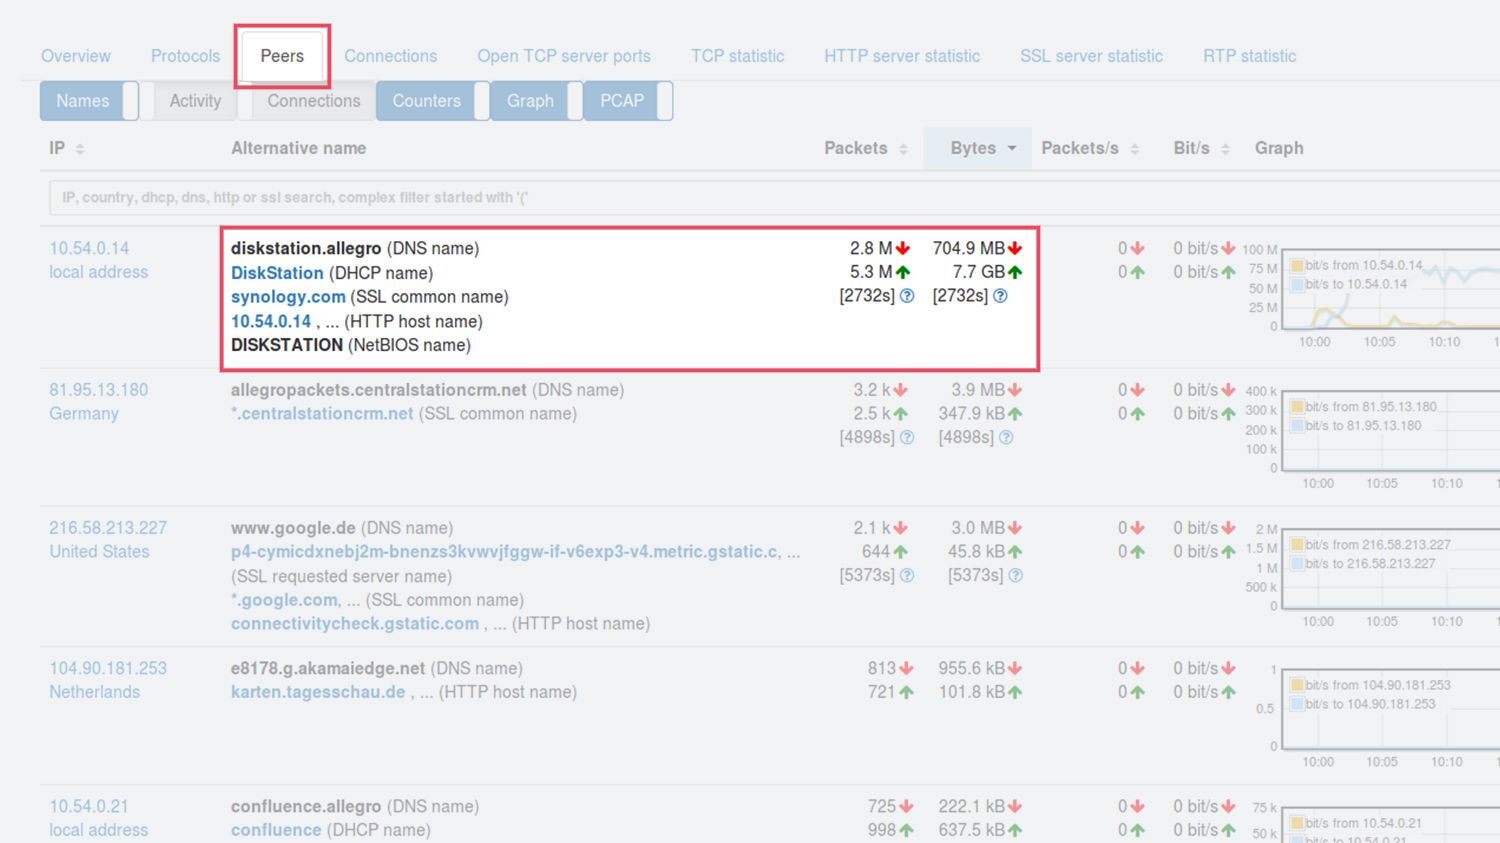
Click on the top IP address to open the detailed view. The name of the user’s PC, its MAC address, and other information will be displayed. By clicking again on the ‘Peers’ tab, all the connections originating from this user are displayed in detail. It turns out that once again the connection to just one peer – in this case a file server named ‘diskstation’ – was responsible for nearly all the traffic.
You now therefore know that one user caused an inordinate amount of traffic and consumed high bandwidth during the period concerned by uploading or downloading data and so probably triggered the problem. If the user isn’t aware of this, an inadvertent time machine backup setting in the MacBook identified in this case may be responsible.