Identifying sporadic malfunctions of the server connection

How the Allegro Network Multimeter can help you solve network problems
Here’s a situation familiar to every system administrator. An employee tells you that they can’t use some of the network services. However, they can’t give you any specific data, such as the exact time at which they couldn’t access which service or whether the same server connection was accessed.
How can you tackle this problem? By using the Allegro Network Multimeter, you can narrow down the cause of the malfunction within a matter of minutes and then take measures to correct it.
First search for the user via the browser-independent web interface. This is done intuitively by entering the user’s name into the full-text search in the IP address list within the central IP section. Matching computers are immediately displayed.
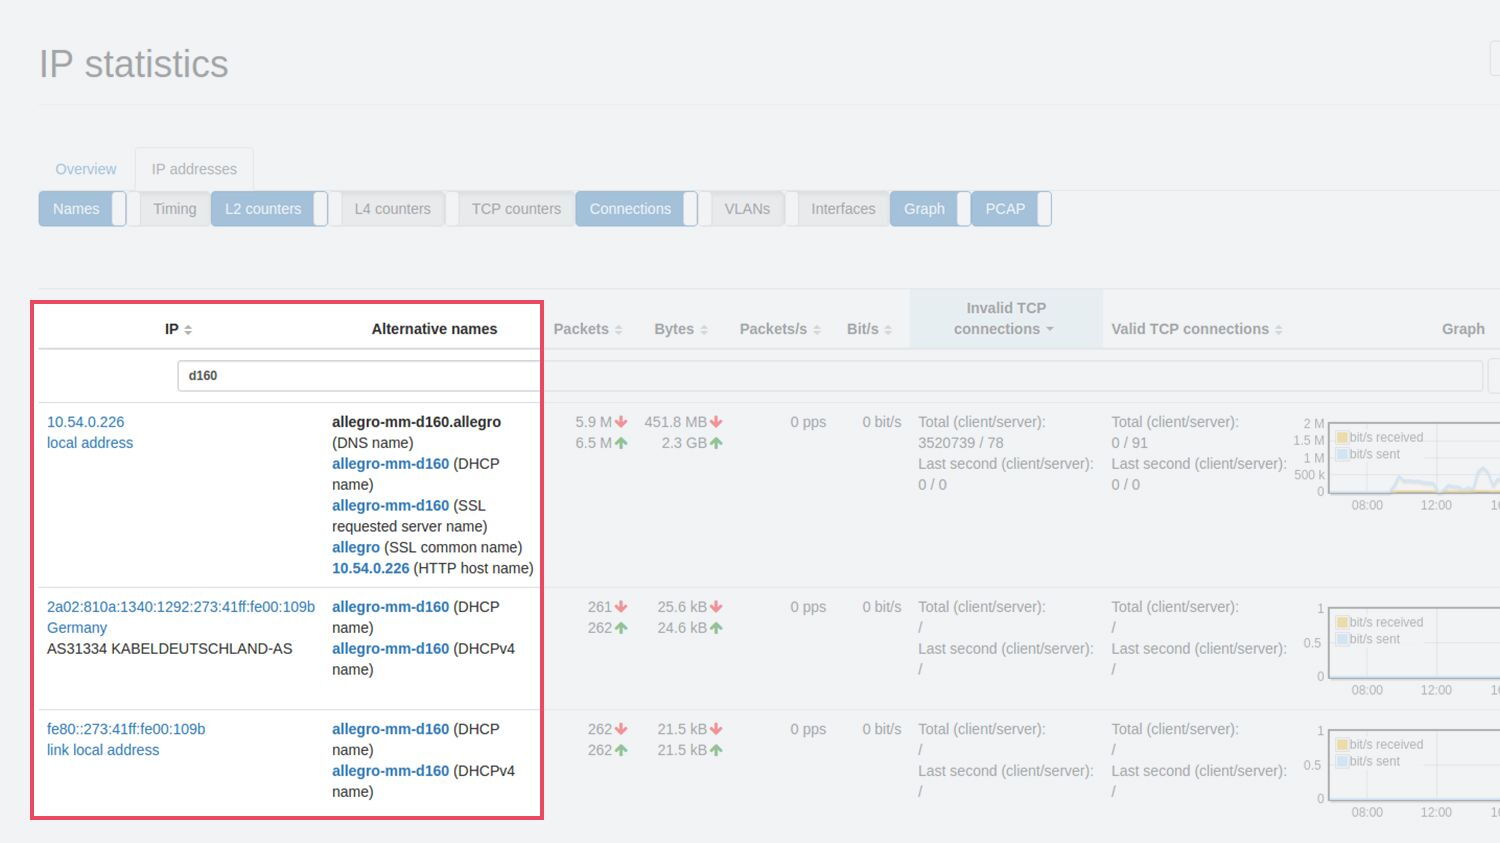
Click to select the computer of the employee concerned. The detailed view which now opens contains a wealth of information broken down via different tabs. Go to the overview page and inspect the faulty server connections.
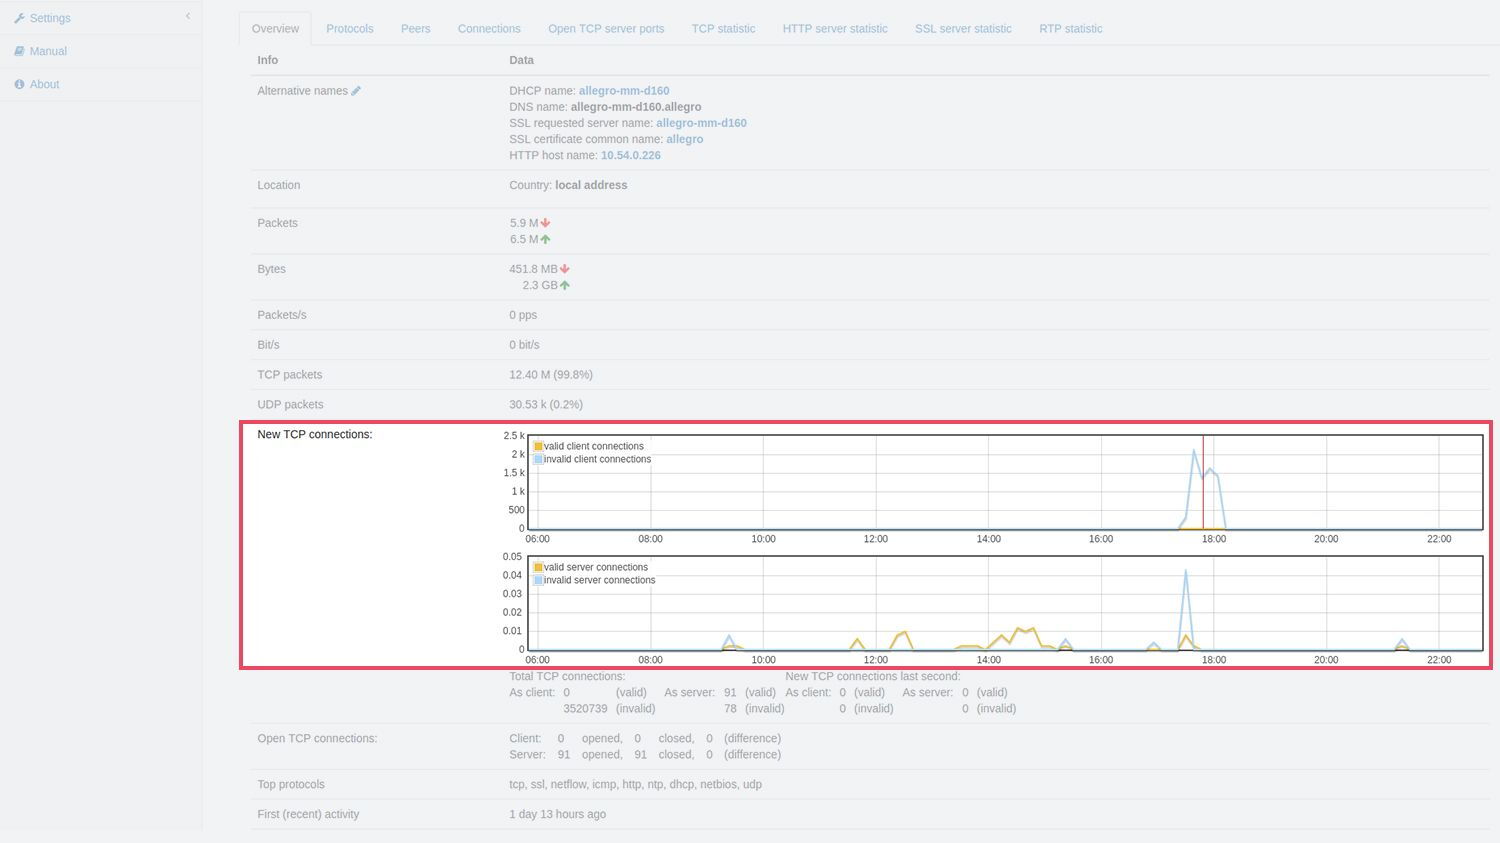
These ‘invalid connections’ are shown in blue in the graph ‘New TCP connections’. By default, the current server connections are displayed. If you zoom out, the time interval expands to show the past few hours. An especially large number of faulty server connections occurring at certain times are immediately apparent.
Your advantages at a glance
- Identifying faulty server connections
- User-friendly search for malfunctions
- Pcap for immediate analysis in the browser
- Pcap for IP pair for downloading
- Real time and retroactive network analysis
- Despite vague specifications – narrow down the malfunction within seconds

Allegro Network Multimeter
Pinpointing faulty server connections
To examine the potenial problem server connections more closely, clicking on a peak limits the time range to this time interval. Similarly, zooming in a few times enables a very short interval to be displayed.
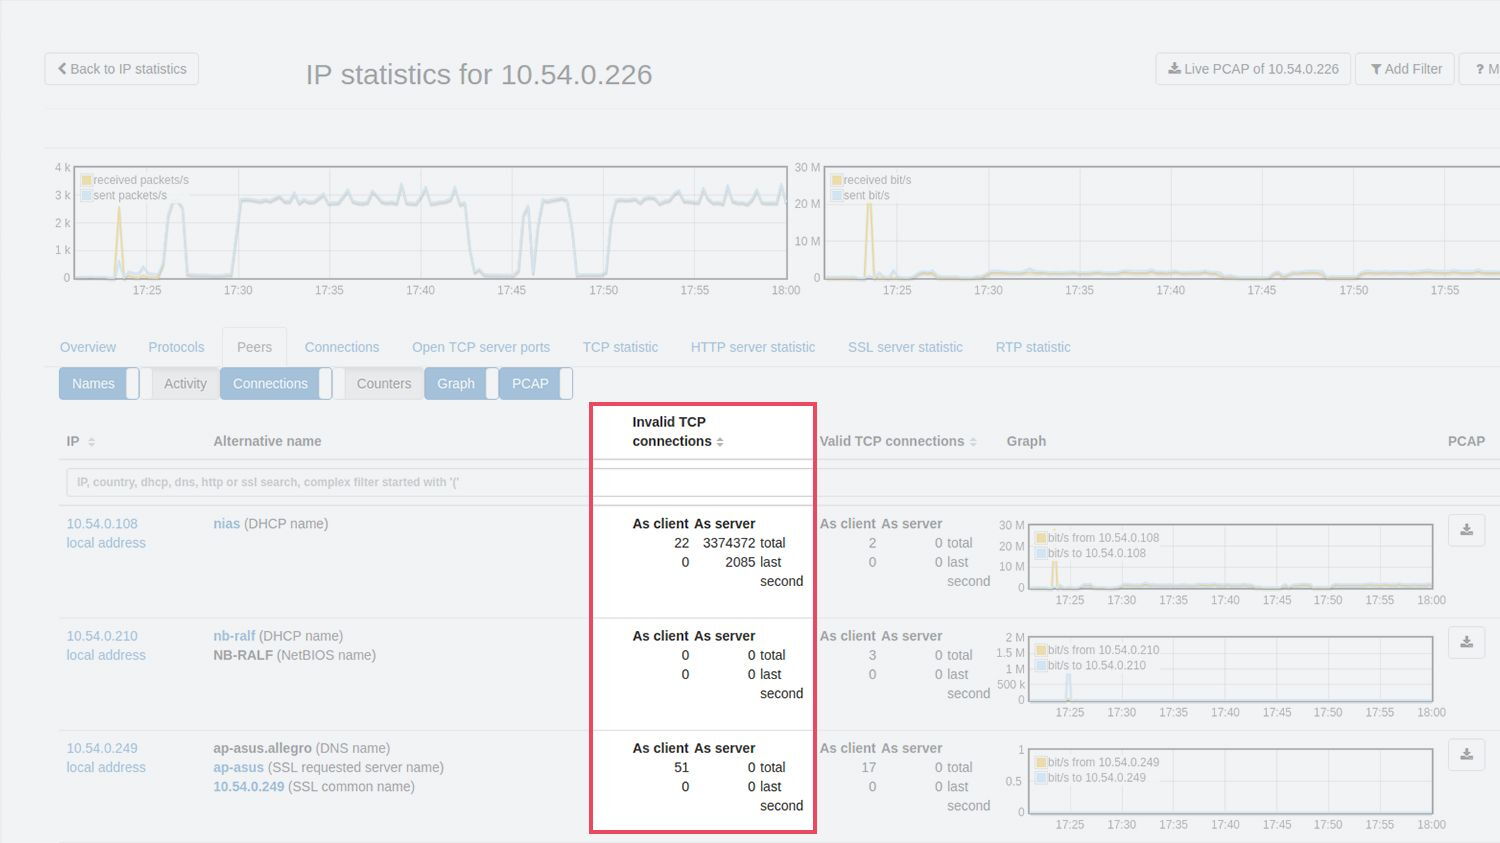
Switching to the ‘Peers’ tab now allows you to see the servers contacted in the time interval concerned. Sort them by ‘invalid connections’ again to immediately see the servers with the most errors (see screenshot). For a more detailed look at why server connections aren’t working, you can now start a recording from the browser for the selected period and IP pair. You can choose between the classic pcap download, e.g. to investigate at a later time, or with Wireshark. Alternatively, you can analyse further in a browser by clicking on the Webshark preview and generate a pcap for direct display, similar to Wireshark. A click on the download button is sufficient to select the analysis tool Webshark or to start the pcap download.
Hence, despite vague user information, you can still identify the affected server in a matter of seconds and examine the malfunction in detail using the isolated network traffic.