Custom dashboards
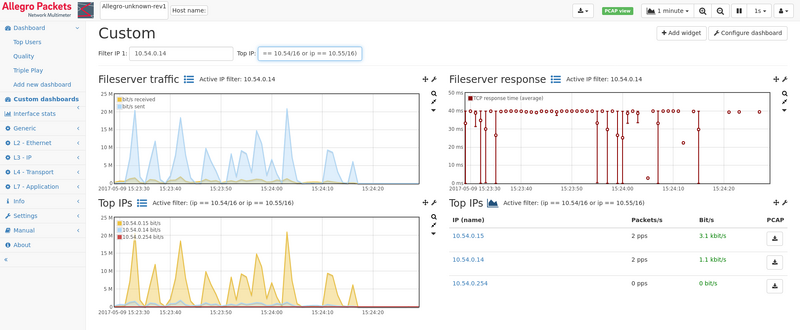
It is possible to define customized dashboards and display configurable widgets that can show different aspects such as the whole traffic, a certain IP group or a particular IP address. By using custom dashboards you can create an overview page of a certain server or an IP group in a certain virtual link group or how it was seen on different remote Allegro Network Multimeter.
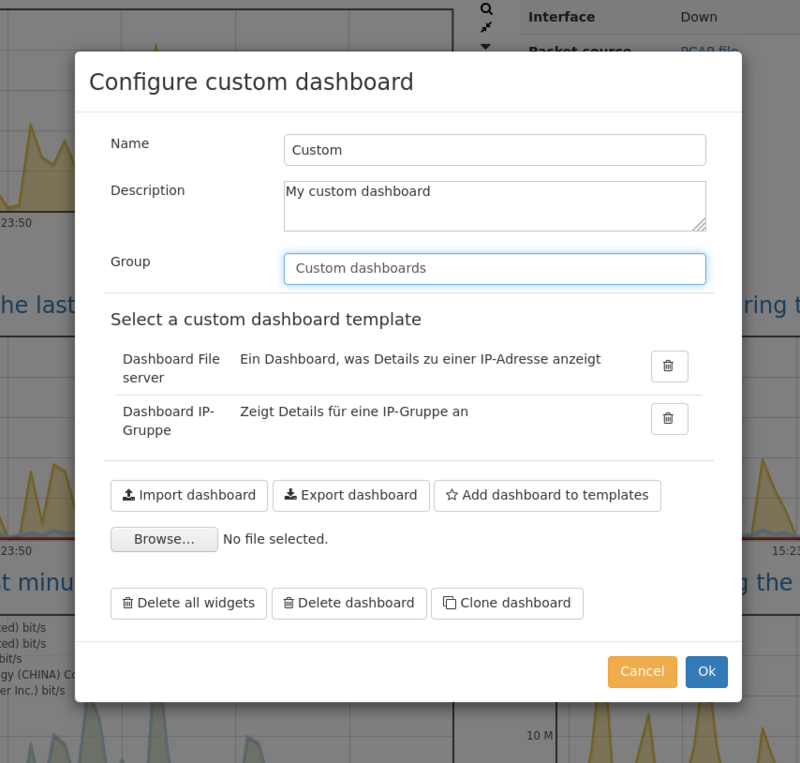
To create a custom dashboard click on the "Add new dashboard" menu item in the "Dashboard" section. A dialog will be displayed that allows you to set a name, description and a group. Dashboards of the same group will form a section in the menu. Dashboards are defined per user session, however, it is possible to publish them as a template so that also other users can use them. Simply click on "Add dashboard to templates" and it will be placed in the template list and can be selected. Export and import as a file is possible, too. The dashboard configuration dialog can also be opened by clicking on "Configure dashboard" in the top right corner.
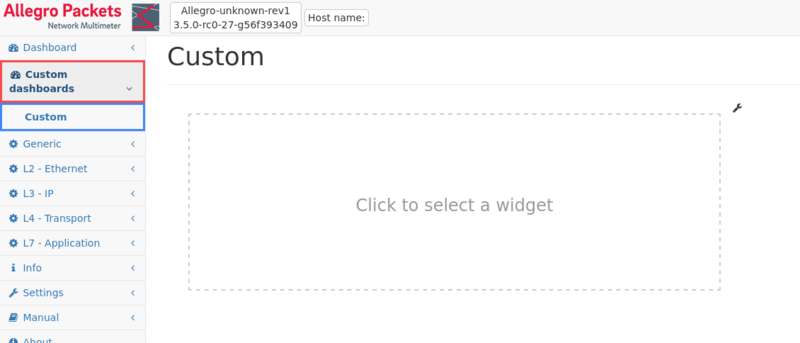
After creating the dashboard, you will be redirected to the new, empty dashboard.
By clicking on the field "Click to select a widget" or "Add widget" a dialog is shown and allows to select a widget from the list. Following widgets are available and are grouped by OSI layer:
- Generic
- Text: This is a widget that allows showing user defined text. Can be useful to structuring the dashboard with captions.
- Textbox: This widget allows typing and storing a text.
- Traffic graph: The graph will show interface throughput or PCAP traffic.
- Virtual link group: This will show traffic of a certain virtual link group.
- Layer 2
- Burst analysis: Displays utilization graphs for fast recognition of bursts per interface or MAC address. Virtual link groups can be used to monitor multiple interfaces.
- Global MAC statistics: Shows global statistics about the analysed MAC traffic. Available statistics are: total-, unicast- , broadcast- and multicast traffic.
- QoS: Shows statistics about a selected quality of service class. See QoS module for more infromation about QoS.
- Top MACs: A list of Top 5 Macs is shown. By clicking on the icon to the right of the caption, the display can be toggled between list or graph.
- VLAN: Show statistics about a specified VLAN. Traffic can be filtered by inner and outer VLAN tags.
- Layer 3
- Country: This widget shows traffic in- and outbound traffic statistics about a specific country.
- DNS server: Show statics about certain DNS server as graph or table. Available statistics are: requests/replies, reply codes and response times.
- IP: This widget displays graph or text information about a certain IP address. The IP address can either be filtered through the dashboards global filter fields or configured per widget. Traffic, TCP, connection, MTU, Layer 7 protocol counters and graphs are available.
- IP group: The IP group widget allows displaying graph or text information of a certain IP group.
- Multicast group: Shows statistics about IGMP and MLD multicast management packets of a specified multicast group as graph or table. See Multicast statistics for more information about the analysed management message types.
- Multicast overview: Show the same statistics as the mutlicast group widget but without a multicast group filter applied.
- QoS: Shows statistics about a selected quality of service class. See QoS module for more infromation about QoS.
- Top IPs: A list of Top 5 IP addresses is shown and can be toggled between list and graph representation.
- Layer 4
- Layer 4 server port: Shows statistics about a layer 4 server port filtered by layer 4 protocols.
- TCP statistics overview: Shows global TCP statistics as graph or table. Available statistics are: handshake times, response times, TCP retransmissions, TCP flags and zero window statistics.
- Layer 7
- HTTP overview: Shows global HTTP statistics as graph or table. Available statistics are: response times and response codes.
- RTP overview: Global statistics about RTP traffic. Available statistics are: Traffic, jitter, packet loss, max audio level and RMS.
- SIP overview: Global statistics about SIP traffic. Available statistics are: Concurrent calls and response codes.
- SSL overview: Global statistics about SSL traffic. Available statistics are: SSL hello handshake times and first data.
- Layer 7 protocol: Shows global statistics about a certain layer 7 protocol as graph or table.
- Top layer 7 protocols: A list of top layer 7 protocols is shown. It can be toggled between list and graph representation.
There is a search bar on top of the dialog that allows for fast searching of certain widgets.
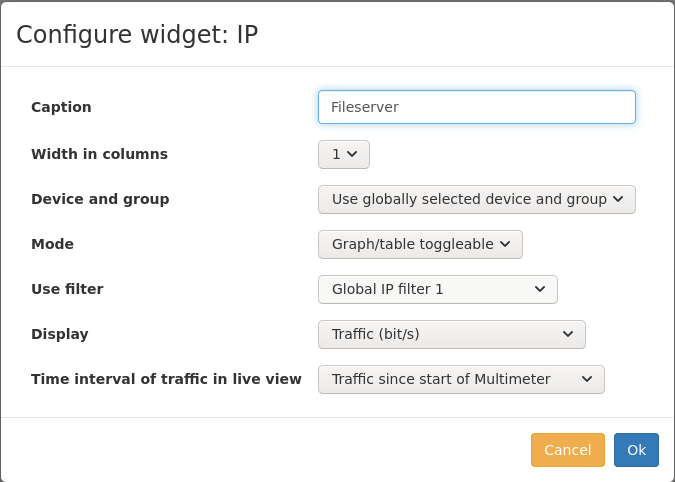
After selecting a widget, the configuration dialog is shown. The widget configuration dialog can also be opened by clicking on the small wrench icon to the right of the widget.
The widget can be configured as follows:
- Caption: The caption displayed on the dashboard
- Width: Either one column width or the whole page (two columns)
- Device and group: A dedicated virtual link group from the local or a remote device can be selected. By default the globally selected virtual link group from the top menu bar is used.
- Direction: Either RX or TX direction where applicable.
- Mode: Whether the widget may be toggled between list and graph representation
- Use filter: Several widgets allow filtering for e.g. an IP address or even a complex filter similar to the filter bar in the corresponding module. The filter can be either used globally so that it can be used for several widgets or locally configured for that particular widget.
- Display: Allows selecting different aspects such as traffic or TCP counters
Widgets can be moved with drag and drop simply by clicking on the two double arrows,dragging it around and dropping it on a drop zone.


