Find Profinet problems
How can you use the Allegro Network Multimeter to quickly and easily examine a network of Profinet devices and find problems?
Read all about it on this page and more on the Profinet module page.
Preparation
Section titled “Preparation”Attach the Allegro Network Multimeter to the Mirror Port of a Profinet-capable Switch or use a Tap. Once placed there, the Multimeter will analyze all packets and collect live and back-in-time Profinet statistics.
We do not recommend installing the Allegro Network Multimeter inline in Bridge mode in a Profinet real-time network since it will cause additional latency of around 50 microseconds. Use a network Tap to maintain a reliable network connection.
We recommend using the packet ring buffer feature since it allows for historical specific packet extraction.
Profinet overview
Section titled “Profinet overview”Start with getting an overview of the Profinet main device and all Profinet devices that communicate with the main device or each other. Open the web interface with a browser and go to L7 - Application → Profinet Statistics.
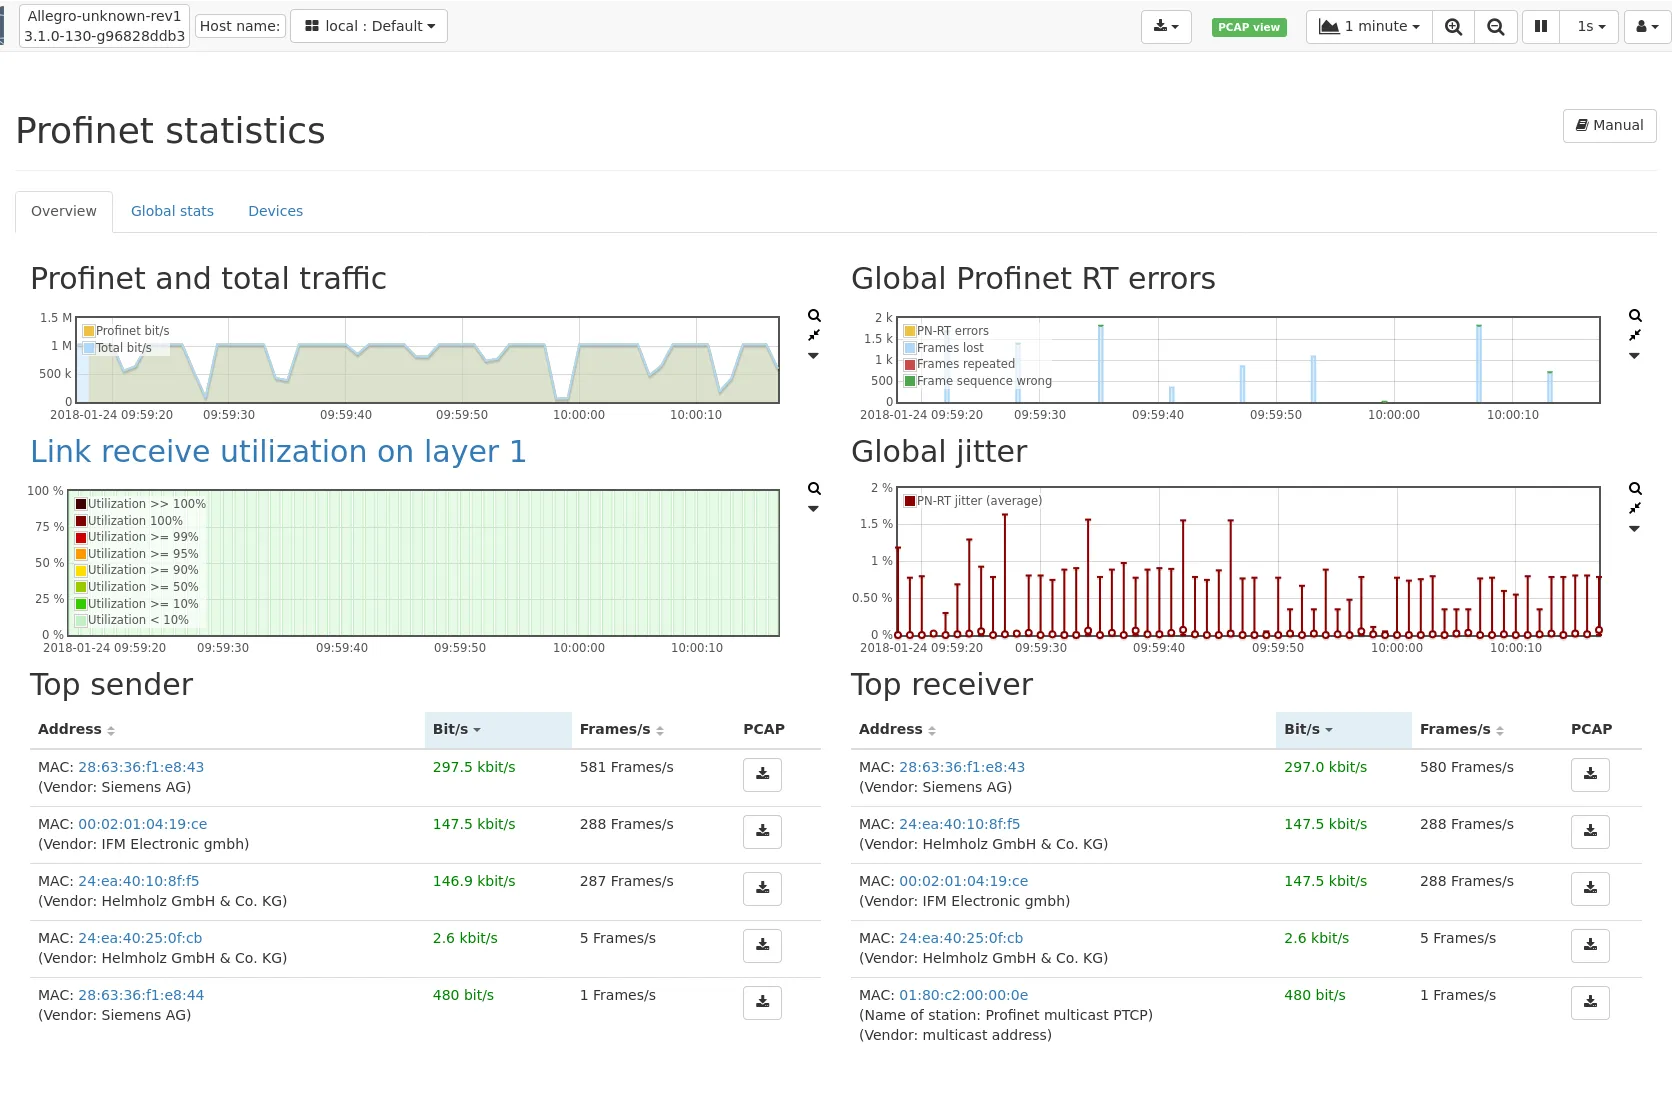
On this page, an Overview of the entire Profinet communication is shown. Here, traffic was running at a constant 250 kbit/s and then it stopped. You can see alarms at around 14:11:53. Errors will be presented in the same way. A jitter graph with minimum, average and maximum values shows at a glance when there is a deviation in the timing of real-time frames. Around the same time the alarms were sent, the jitter increases significantly.
The PCAP button allows you to capture the entire Profinet-related traffic.
If you wish to see what happened at the same time at this network point, use the mouse to zoom into a time frame, then navigate to the Dashboard. It will show an overview of the entire traffic during this time interval. This helps to identify Profinet issues which are related to non-Profinet traffic such as updates or streams which can disturb a Profinet setup.
Profinet devices
Section titled “Profinet devices”An overview of all Profinet devices can be seen in the Devices tab.
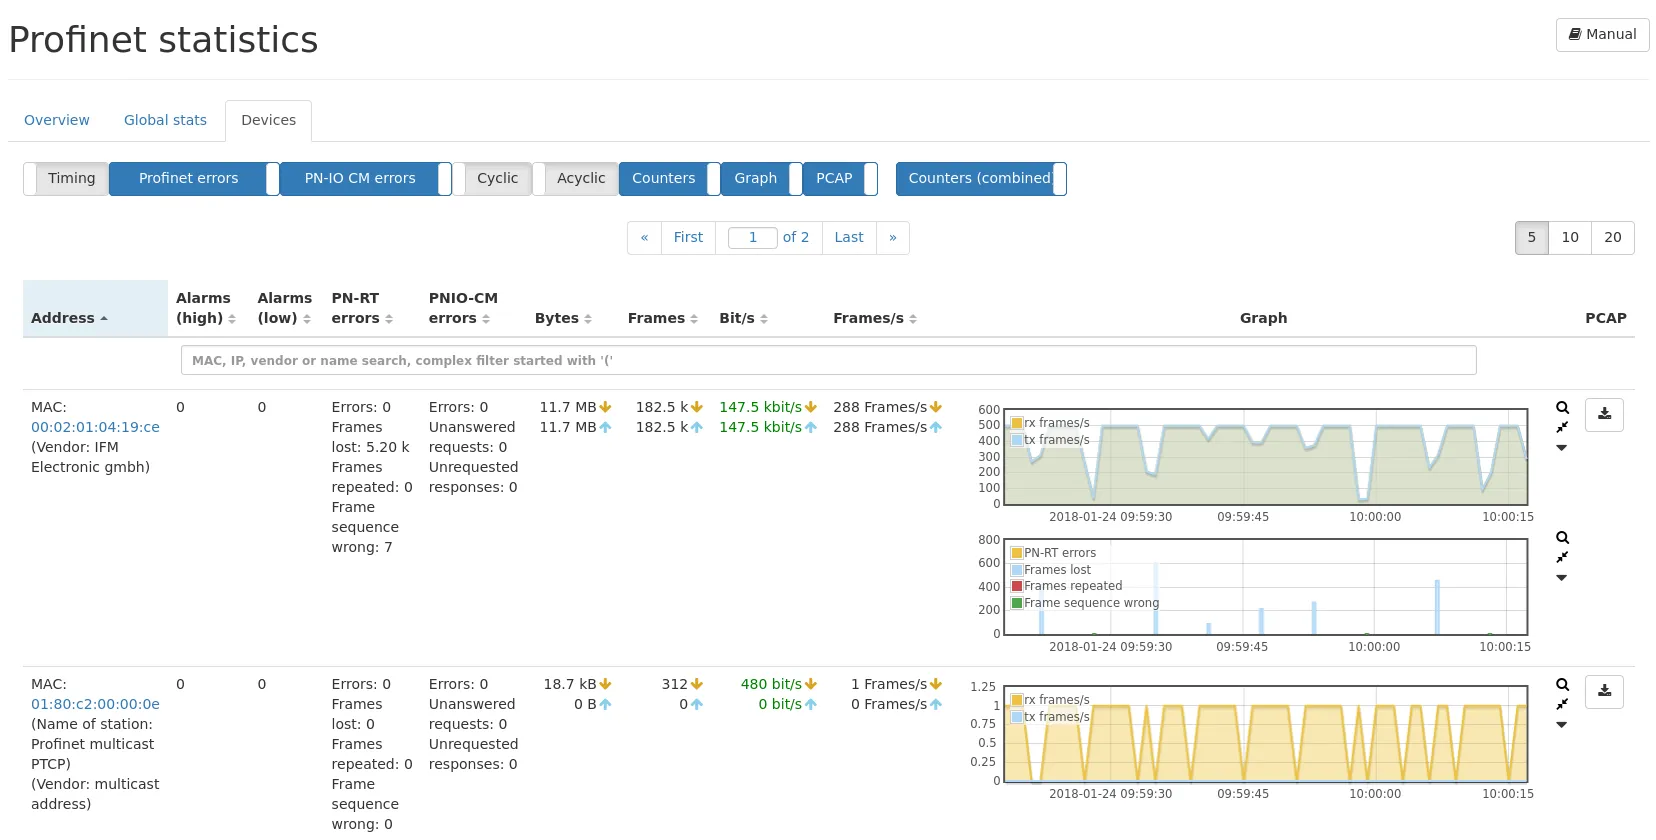
All significant information is displayed such as byte count and the number of frames in the selected time span. For fast recognition of alarms and errors you can sort the device table by clicking on the related column header. A specific device can be filtered by typing its station name, vendor, MAC or IP address into the filter field.
MAC addresses are displayed for every Profinet device. IP addresses and Profinet station names will be shown for all devices as soon as related frames have been seen.
Two of the alarms on the Profinet statistics page have been issued from WAGO device 00:30:de:06:66:a5 and WAGO device 00:30:de:06:66:fa with the station name montagekanuelekappe.
By clicking on a MAC address you can see detailed statistics for a specific Profinet device.
Profinet device
Section titled “Profinet device”Statistics for a device include incoming and outgoing traffic, jitter and the number of outgoing alarms and errors.
The PCAP button enables you to create a capture of all incoming and outgoing traffic for that particular Profinet device.
Communication relations
Section titled “Communication relations”The Communication relations tab lists all groups of incoming and outgoing frames from this device. Both source and destination are shown, so the direction can be easily recognized.
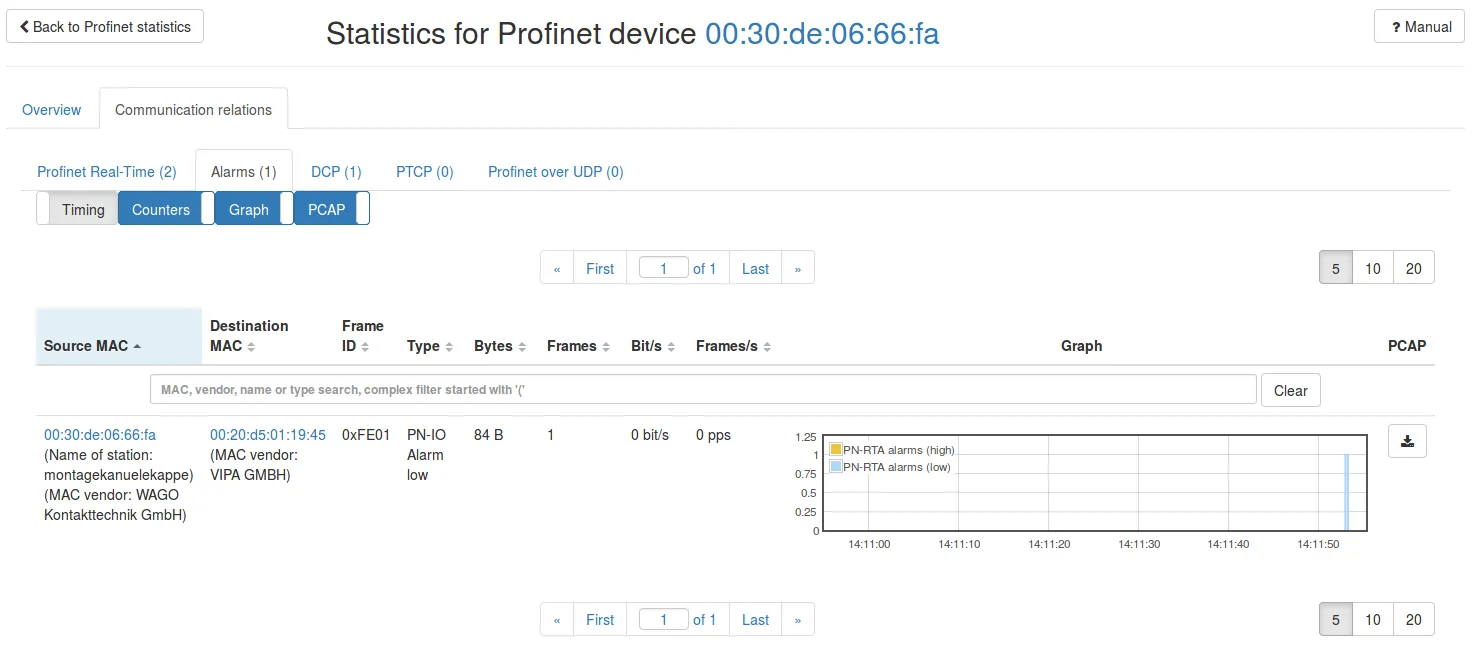
The Alarms tab shows all alarms that have been sent by this device. Here the WAGO device 00:30:de:06:66:fa with the station name montagekanuelekappe sent an alarm with low priority to the VIPA device 00:20:d5:01:19:45.
To get a capture of the data during this selected time frame for further analysis, click on the PCAP button on the right.
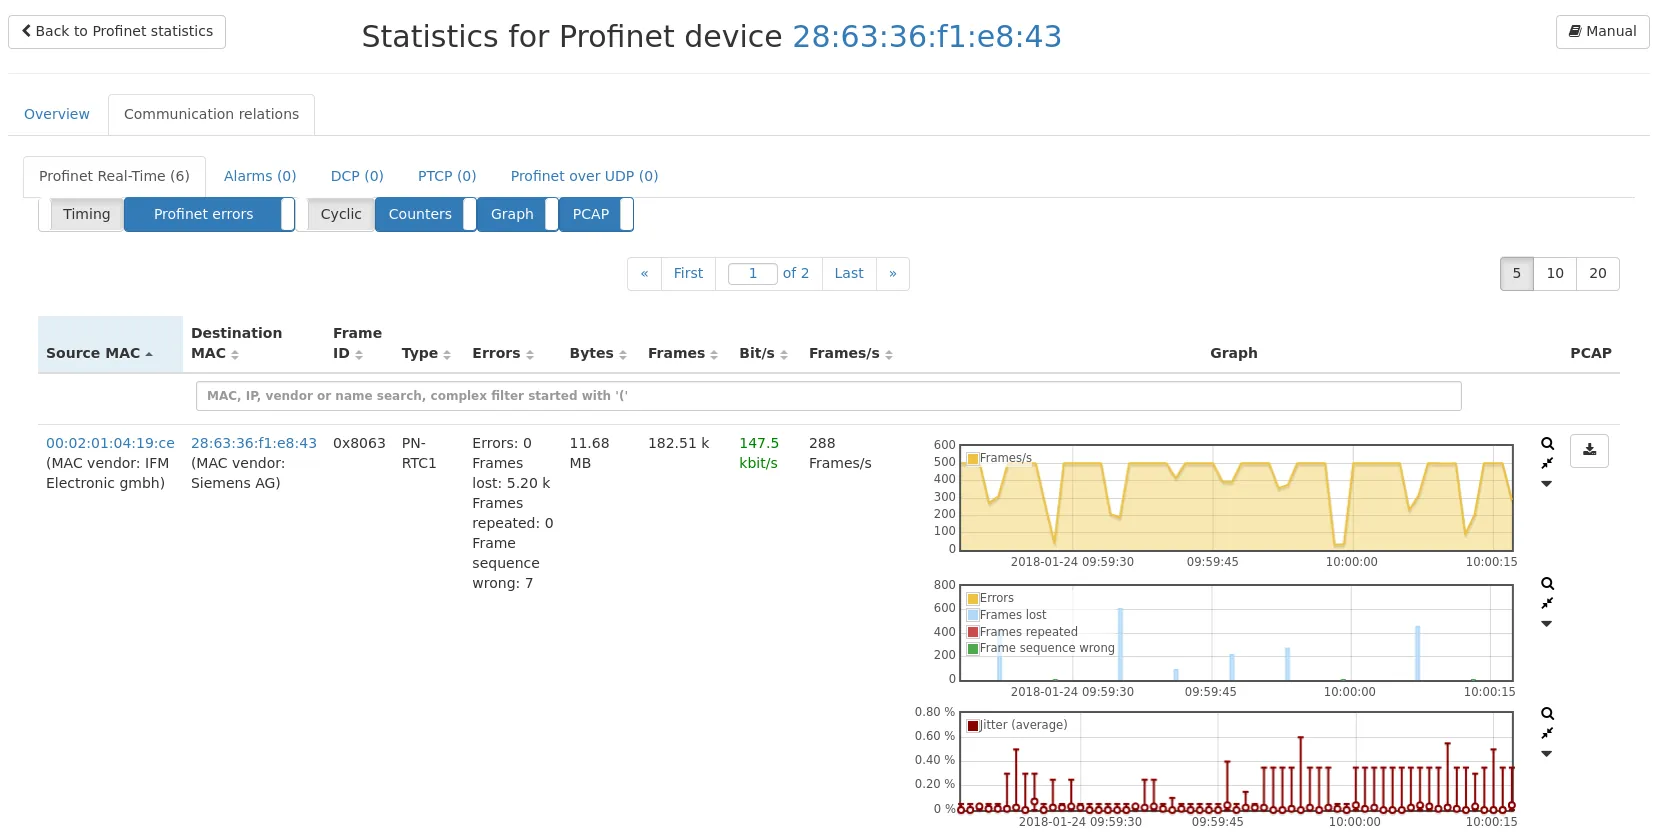
In the Profinet real-time tab you will see all real-time communication and checks for poor jitter values.
For the jitter calculation, the clock period of two adjacent frames is calculated first by using the cycle counters. The clock period is then compared to the measured time between these two frames. A good jitter value would be zero, meaning all frames arrive without deviation within the same clock period. A poor jitter value would be equal to or even larger than the cycle time.
Does the device have a problem with sending frames and is it the only one with poor jitter values or even frame losses? Or is a Switch in the network causing the problem? Check the jitter values and errors of other Profinet devices that communicate over the same Switch. Or, attach the Allegro Network Multimeter to another Switch and see if the jitter and errors decrease.
More information about Profinet monitoring and troubleshooting with Allegro Network Multimeter can be found on the very detailed Profinet module page.