Analyze connections between remote sites: Difference between revisions
| Line 71: | Line 71: | ||
The "Measurement" tab shows the results of the analysis of packet data | The "Measurement" tab shows the results of the analysis of packet data | ||
between the master and remote devices. | |||
At the bottom, the fourth graph shows the packet rate of all traffic | At the bottom, the fourth graph shows the packet rate of all traffic | ||
| Line 80: | Line 80: | ||
To identify packet loss during a time interval, first select the | To identify packet loss during a time interval, first select the | ||
corresponding zoom level to see the | corresponding zoom level to see the entire time range. You can also | ||
select the time range by clicking into the graph. | select the time range by clicking into the graph. | ||
The second and third graph shows the number of packets lost | The second and third graph shows the number of packets lost | ||
separately for each direction. If packet loss | separately for each direction. If packet loss occurred, you will see a | ||
non-zero | non-zero value in the graph. | ||
Keep in mind that the analysis waits the configured maximum packet | Keep in mind that the analysis waits the configured maximum packet | ||
delay before deciding a packet is | delay before deciding if a packet is lost. This means that the | ||
time of the packet loss is actually before the data point in the | time of the packet loss is actually before the data point in the | ||
graph, up to the maximum number of packet delay | graph, up to the maximum number of packet delay seconds in the past. | ||
Example: In the graph above, a packet loss is indicated at | Example: In the graph above, a packet loss is indicated at | ||
17:45:34. For a configured maximum packet delay of 5 seconds, the | 17:45:34. For a configured maximum packet delay of 5 seconds, the | ||
original packet | original lost packet was sent 5 seconds earlier starting from | ||
17:45:29. | 17:45:29. | ||
| Line 100: | Line 100: | ||
The "Two-way latency" graph shows the minimum, maximum and average | The "Two-way latency" graph shows the minimum, maximum and average | ||
delay of both | delay of both aggregated directions. Select the zoom level for the | ||
required time period and check if there are any unusual events in the graph. | |||
A high maximum but low average value means that there have been few | A high maximum but low average value means that there have been a few | ||
points in time where the delay was high but the | points in time where the delay was high but the majority of the traffic experienced a | ||
lower delay. | |||
A high maximum and high average indicates a general problem | A high maximum and high average indicates a general latency problem. | ||
A high latency does not necessarily mean | A high latency does not necessarily mean low bandwidth since network | ||
buffers can | buffers can handle latency and still provide high bandwidth. But | ||
real-time applications such as audio calls or video chats will | |||
exhibit poorer quality due to high latency. | |||
=== How to identify traffic happening during packet loss or high latency === | === How to identify traffic happening during packet loss or high latency === | ||
First select the | First, select the relevant time window when the packet loss or high | ||
latency | latency occurred. Consider the packet delay configuration value to | ||
select a time early enough to include the first arrival time of lost | select a time early enough to include the first arrival time of lost | ||
packets. | packets. | ||
| Line 129: | Line 128: | ||
window. | window. | ||
Packet loss for TCP connections always | Packet loss for TCP connections always generate retransmission | ||
packets. Toggle the display of "TCP counters" on the top bar and sort | packets. Toggle the display of "TCP counters" on the top bar and sort | ||
the table for "TCP retransmissions" to see the IP addresses with the | the table for "TCP retransmissions" to see the IP addresses with the | ||
most retransmissions in that time period. | most retransmissions in that time period. | ||
Select an | Select an IP address which shows a high retransmission rate and check its peers or connections to | ||
identify the traffic | identify the traffic during the packet loss or high latency period. | ||
Revision as of 12:04, 28 April 2020
Problem
Often multiple locations are connected by dedicated lines. Sometimes, network problems are reported which cannot be easily tracked down. These can be caused by issues in the local network, the remote network, or the dedicated line itself.
This section describes how to use two Allegro Network Multimeters to measure packet loss and network latency between a local installation and a remote site.
The image shows an example setup for measuring packet loss and latency between two networks which are connected via the Internet.
Requirements
1. You need two Allegro Network Multimeters (any model).
2. One Multimeter (the master device) will receive traffic information from the remote Multimeter via a atandard SSL connection. This means the master device must be able to connect to the remote device. If a firewall is in place between both devices, an additional rule might be necessary to connect the remote device on port 443.
Device installation
1. Install the master device somewhere in your network where it can see the traffic sent and receievd to the remote site. The Multimeter can be installed on a Mirror Port on a Switch which sees all the traffic, or inline between the local network and uplink to the remote site.
2. Install the device on the remote site at a network position where it sees all traffic from and to the local network. Again, this can be a Mirror Port on a Switch on the remote site, or inline between the remote network and the link to the local network.
Configuration
1. Remote device: There are no special configuration settings necessary on the remote device. You need the following information to use the master device:
- The IP address of the management port.
- The TCP port on which the web site of the Multimeter is accessible (defaults to 443).
- The username and password of the admin user (or any other user with admin role).
2. Master device:
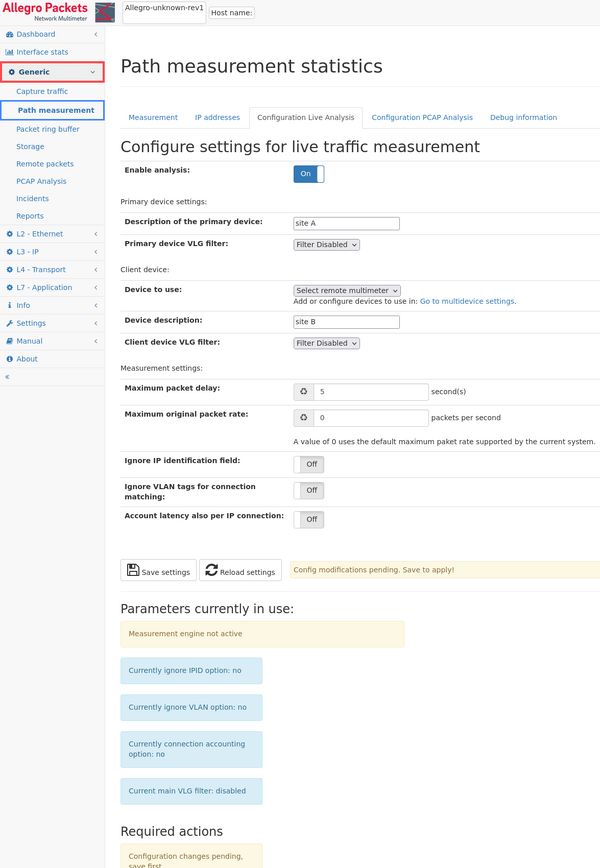
(a) Access the web page of the Multimeter and go to "Generic -> Path measurement".
(b) Switch to the configuration tab.
(c) Click on the toggle button to enable the feature.
(d) Enter an descriptive name for the master device to make it easier to read the statistics.
(e) For the remote device, enter the information described above. You can select a descriptive name for this device also.
(f) Enter a maximum packet delay. This parameter defines how long the master device waits for data from the remote device until it decides whether or not a packet as been lost. Larger values requires more memory. Typical values are between 2 and 5 seconds.
(g) Finally save the configuration settings.
(h) At the bottom of the page a note will appear in most cases that a restart of the packet processing is necessary. Follow the link to the administration page and click on "Restart processing". Be aware that this will interrupt the network connection for a few seconds (if in Bridge mode); you will lose all previously measured data.
(i) Return to the "Generic -> Path measurement" page.
(j) The "Measurement" tab should indicate that the measurement status is either warming up or running.
(k) The "Remote client status" should say "connected". If not, a button appears which can be clicked to reconnect to the remote device. Any error will be displayed in a information box.
Evaluation
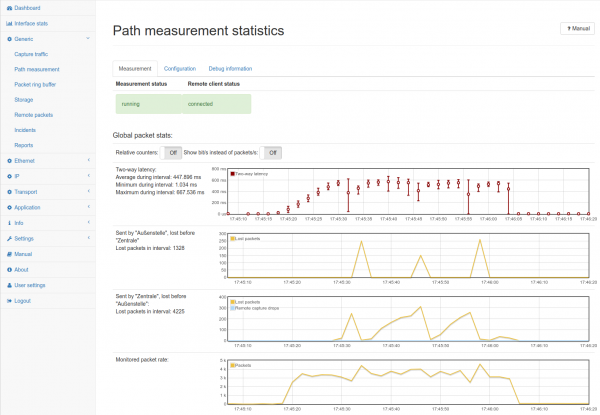
The "Measurement" tab shows the results of the analysis of packet data between the master and remote devices.
At the bottom, the fourth graph shows the packet rate of all traffic that is used for measurement. This includes the traffic seen on both devices, but excludes the traffic that is only seen on one device.
Checking packet loss
To identify packet loss during a time interval, first select the corresponding zoom level to see the entire time range. You can also select the time range by clicking into the graph.
The second and third graph shows the number of packets lost separately for each direction. If packet loss occurred, you will see a non-zero value in the graph.
Keep in mind that the analysis waits the configured maximum packet delay before deciding if a packet is lost. This means that the time of the packet loss is actually before the data point in the graph, up to the maximum number of packet delay seconds in the past.
Example: In the graph above, a packet loss is indicated at 17:45:34. For a configured maximum packet delay of 5 seconds, the original lost packet was sent 5 seconds earlier starting from 17:45:29.
Checking latency
The "Two-way latency" graph shows the minimum, maximum and average delay of both aggregated directions. Select the zoom level for the required time period and check if there are any unusual events in the graph.
A high maximum but low average value means that there have been a few points in time where the delay was high but the majority of the traffic experienced a lower delay.
A high maximum and high average indicates a general latency problem.
A high latency does not necessarily mean low bandwidth since network buffers can handle latency and still provide high bandwidth. But real-time applications such as audio calls or video chats will exhibit poorer quality due to high latency.
How to identify traffic happening during packet loss or high latency
First, select the relevant time window when the packet loss or high latency occurred. Consider the packet delay configuration value to select a time early enough to include the first arrival time of lost packets.
For example, if the value is set to 5 seconds, include at least 5 seconds before a packet loss event in the time window.
Once the time window has been selected, switch the "IP -> IP statistics" to see which IP addresses had traffic within the time window.
Packet loss for TCP connections always generate retransmission packets. Toggle the display of "TCP counters" on the top bar and sort the table for "TCP retransmissions" to see the IP addresses with the most retransmissions in that time period.
Select an IP address which shows a high retransmission rate and check its peers or connections to identify the traffic during the packet loss or high latency period.


