Burst analysis: Difference between revisions
No edit summary |
No edit summary |
||
| Line 16: | Line 16: | ||
For every interface or MAC address a graph is shown which displays utilization values. Utilization values are stacked on eachother and sum up 100%. | For every interface or MAC address a graph is shown which displays utilization values. Utilization values are stacked on eachother and sum up 100%. | ||
A tooltip shows all utilization values for the desired time slot. | A tooltip shows all utilization values for the desired time slot. | ||
In Live view mode a bar is shown per second, thus if e.g. the | In Live view mode a bar is shown per second, thus if e.g. the '''Utilization 100%''' value is at 3%, the link was completely busy for a total of 3% of the measurement intervals in that second. | ||
For back-in-time intervals or when a larger interval is displayed, the duration of a bar is longer and the utilization values are aggregated accordingly. | For back-in-time intervals or when a larger interval is displayed, the duration of a bar is longer and the utilization values are aggregated accordingly. | ||
The duration can be found out by clicking on the triangle icon next to the graph. | The duration can be found out by clicking on the triangle icon next to the graph. | ||
The utilization values are counted exclusively. E.g. | The utilization values are counted exclusively. E.g. '''Utilization >= 99%''' shows the amount of time when the link had an utilization of greater or equal 99% but lesser than 100%. Those utilizations are counted seperately and shown as '''Utilization 100%'''. | ||
The sliders on top of the graphs allow for displaying or hiding several utilization values. These settings are stored per user. | The sliders on top of the graphs allow for displaying or hiding several utilization values. These settings are stored per user. | ||
Together with the interface throughput incidents you can easily see when bursts occured and how long they lasted. | Together with the interface throughput incidents you can easily see when bursts occured and how long they lasted. | ||
| Line 26: | Line 26: | ||
'''Utilization 100% configuration''' | '''Utilization 100% configuration''' | ||
Next to the graph the configured | Next to the graph the configured '''Utilization 100%''' threshold is shown and can be configured by clicking on the change link. | ||
For interfaces either the link speed or any other Mbit/s value can be used. For MAC addresses the tx and rx thresholds can be configured. | For interfaces either the link speed or any other Mbit/s value can be used. For MAC addresses the tx and rx thresholds can be configured. | ||
The traffic’s bandwidth will be shown as | The traffic’s bandwidth will be shown as '''Utilization >> 100%''' if it is larger than 105% of the configuration value. | ||
Revision as of 13:46, 29 April 2020
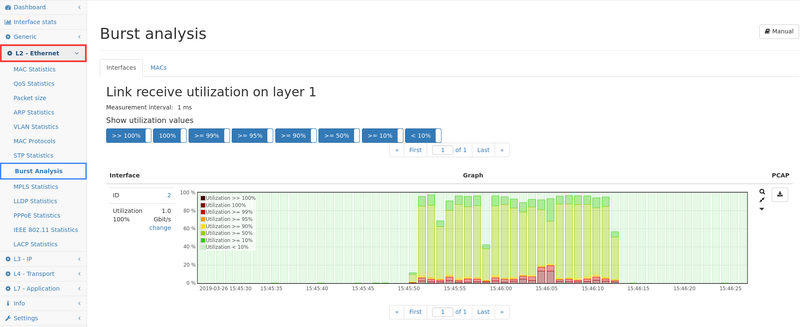
The burst analysis module measures throughput per interface or MAC address and displays utilization graphs for fast recognition of bursts.
Measurement
The burst analysis module measures throughput for every interface in a 1 ms interval. Measurement is always done on layer 1, the packet length accounting setting is ignored.
Web interface
The web interface shows a tab with an interface list. Additionally there is a tab with up to five MAC addresses that can be added and removed. For every interface or MAC address a graph is shown which displays utilization values. Utilization values are stacked on eachother and sum up 100%. A tooltip shows all utilization values for the desired time slot. In Live view mode a bar is shown per second, thus if e.g. the Utilization 100% value is at 3%, the link was completely busy for a total of 3% of the measurement intervals in that second. For back-in-time intervals or when a larger interval is displayed, the duration of a bar is longer and the utilization values are aggregated accordingly. The duration can be found out by clicking on the triangle icon next to the graph. The utilization values are counted exclusively. E.g. Utilization >= 99% shows the amount of time when the link had an utilization of greater or equal 99% but lesser than 100%. Those utilizations are counted seperately and shown as Utilization 100%. The sliders on top of the graphs allow for displaying or hiding several utilization values. These settings are stored per user. Together with the interface throughput incidents you can easily see when bursts occured and how long they lasted.
Utilization 100% configuration
Next to the graph the configured Utilization 100% threshold is shown and can be configured by clicking on the change link. For interfaces either the link speed or any other Mbit/s value can be used. For MAC addresses the tx and rx thresholds can be configured. The traffic’s bandwidth will be shown as Utilization >> 100% if it is larger than 105% of the configuration value.
