Snort: Difference between revisions
m (remove in-dev warning) |
(add usage info) |
||
| Line 55: | Line 55: | ||
All files in this view are loaded by Snort, so no additional action needs to be taken to add a new file to the ruleset. | All files in this view are loaded by Snort, so no additional action needs to be taken to add a new file to the ruleset. | ||
== Usage == | |||
[[File:Snort Analysis Results.png|thumb|Snort Analysis Results]] | |||
Snort analysis are triggered in the capture dialog. If the feature has been enabled, the button to begin the analysis is located in the bottom right-hand corner of the modal. Should there be no button named "Snort analysis", make sure to check the global settings if the feature is enabled. | |||
When invoking the analysis a new modal will open which displays the results of the analysis. The result modal is a list of detected incidents, sorted by order of appearance. An entry in this list has the following structure: | |||
{| class="wikitable" | |||
|+Snort results table structure | |||
!Severity | |||
! Time | |||
!Classification | |||
!Message | |||
!Connection | |||
|- | |||
|This is denoted by the color on the left hand side of the row. | |||
| The packet timestamp of the offending packet. | |||
|A normalized name for the type of incident that occured. | |||
| A more detailed description of the incident | |||
| A diagram of the connection in which the incident occured. The IPs can be clicked to go to the IP detail page, and on the right there is an "external link" icon that opens the connection details page in a new tab. | |||
|}Additionally, on the right hand side of the modal is another color band that serves as a rough overview over all incidents. The band is static and roughly aligned with the scroll bar to make it easier to navigate to specific severity incidents. | |||
Snort works by reading a rule file which contains a list of rules used to match packets against. These rules can match subnet, direction, protocol, payload contents, and more (see the Snort documentation for more information on rules), and are given a classification, message and priority, which are displayed in the analysis results. Internally this feature uses a community rule set which is available for free and receives periodic updates. '''Note:''' The Allegro Network Multimeter (currently) does NOT automatically update this rule set. We are deploying the same rule set to all devices independent of the date of installation. Thus the analysis may not be able to detect zero day exploits and should not be relied on when trying to detect recently discovered attack vectors. | |||
At the moment, only critical and severe incidents are reported (Snort priorities 0 and 1). The classification and message strings are taken directly from the rule that triggered this incidents. | |||
Latest revision as of 08:55, 28 July 2025
Beta Feature
This feature is still in active development and is therefore subject to changes in the future. There may be bugs or unexpected behavior when using this feature.
Version 4.3.0 of the Allegro Network Multimeter introduced Snort as a new capture method for network traffic. Similar to the Webshark analysis this capture mode does not produce raw packets, but instead sends them to another tool for further processing. With Snort the user is able to conveniently analyze the traffic in their network for potential attacks or intrusions, both live and retroactively.
Configuration
For Snort to function properly it needs to be configured. The multimeter comes pre-equipped with the community ruleset to provide a basic set of rules to cover the most well-known and common attacks in a network. Note that currently no updates are provided for this ruleset by Allegro Packets, instead the user is expected to keep their ruleset up do date themselves.
All configurations of the Snort analysis are done via the Global Settings, under Generic Settings > Snort analysis.
Configuring memory
Snort needs a certain amount of memory to be able to perform the intrusion detection and threat analysis. The more memory Snort is configured to use, the less memory will be available for the in-memory databases of the multimeter. Snort may only use half of the systems memory at max, but generally the software is able to run with less than one gigabyte of memory. A minimum of 256MB is required (and also the default) to use this feature, as lower values can cause Snort to hang up and crash. If you are experiencing similar issues, try raising the memory threshold.
Below the slider for maximum memory, a value for "Usable memory" is displayed. This value is a soft memory limit for Snort, which will cause it to be throttled when it reaches it. The usable memory is 5MB below the maximum. If Snort should reach the true maximum memory threshold it will immediately be killed by the OOM manager.
Changing this setting requires a processing restart in order to allocate the configured memory.
Configuring Snort
Config
Snort can be configured via Lua scripts which are executed in a sandboxed environment at startup. The multimeter is delivered with the default configuration files of Snort, with the exception that some of the variables have been moved to a new config.lua file. This file is included before everything else.
To learn more about how Snort configuration works, refer to their documentation.
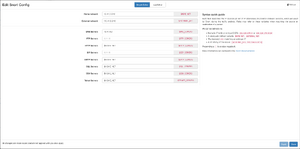
In order to edit this configuration the multimeter provides a web-based interface to either change the config.lua via a GUI, or to edit any configuration file directly. To start editing the configuration click the "Edit config" button. This opens a new modal providing the two editing modes, which can be switched via the buttons at the top center of the window.
Simple editor
This is the first editing mode, and is the one selected by default when opening the config modal. It provides a GUI which allows the user to edit the variables stored in the config.lua. Note that this implies that config.lua is a managed file, which means that directly editing this file is discouraged. As the warning in this file states, editing the values of variables will work fine, however adding new content to the file will cause it to be overridden once the simple editor is used for the next time.
The simple editor provides only a few values that can be edited. Users are encouraged to adjust these values according to their network setup. Setting the home and external network is the only strictly necessary configuration, as the other values are derived from them. The default values for these networks is "any". Refer to the Snort documentation (see above) to find out which values are allowed. Values with a dollar sign ($) in front of them are variables, e.g. setting your DNS servers to $HOME_NET will set the value of the DNS servers field to the value of the Home network field. This is the default.
Modifications to these values are not committed until the "Apply" button is pressed.
Lua editor
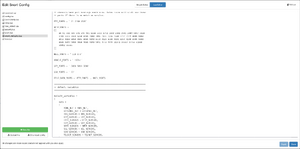
This is the "advanced" configuration mode for Snort, and is toggled by clicking the appropriate button at the center top of the modal.
This view provides a text editor interface which allows for editing any of the Snort configuration files. The left hand side provides a file browser displaying all files in Snort's configuration folder. This does not necessarily mean that all of these files are used in the configuration. Only files included by an active configuration file are used. The analysis invokes Snort with snort.lua as the config file, so any other config files need to be included either by snort.lua, or one of its included files.
While the config.lua is displayed in this list, it is discouraged to edit it directly.
It is possible to create new files via the button at the bottom of the file list. Hovering over a file reveals four buttons:
- Rename file
- Delete file
- Download file
- Restore file
Changes to files (including deleting a file) are not committed until the "Apply" button is pressed. Restoring a file discards uncommitted changes. In the case of default config files (i.e. files that are shipped by default with the multimeter firmware) can also be deleted and recovered later. After deletion they will appear greyed out in the file list.
New files can be created by clicking the green "New file" button at the bottom of the file list on the left hand side of the modal. Below this button there are two more buttons that allow for file uploads and downloads. Downloading the config will zip all config files and download the archive.
Rules
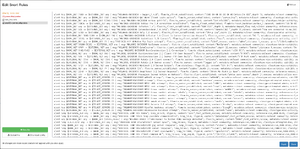
Snort needs a set of rules in order to know what malicious network traffic looks like. The Snort documentation goes into exhaustive detail about how rules are written, and we recommend users who are interested in writing their own rules read it carefully. The multimeter comes pre-equipped with an older version of the community ruleset, which is a file containing a huge list of rules which is not up-to-date, but still provides a good starter set to detect the most common suspicious network activity. Updates to this ruleset are not provided, so users who want to use the most recent set of rules need to keep this ruleset updated themselves.
To start editing the ruleset click the "Edit rules" button. This will bring up a modal displaying a file editor which is functionally identical to the Lua editor . From here it is possible to create new ruleset files as well as editing or deleting existing ones.
Tip: Users who want to stay up-to-date and get access to rulesets containing the most recent exploits and attack vectors may want to consider subscribing to Snort's official ruleset.
All files in this view are loaded by Snort, so no additional action needs to be taken to add a new file to the ruleset.
Usage
Snort analysis are triggered in the capture dialog. If the feature has been enabled, the button to begin the analysis is located in the bottom right-hand corner of the modal. Should there be no button named "Snort analysis", make sure to check the global settings if the feature is enabled.
When invoking the analysis a new modal will open which displays the results of the analysis. The result modal is a list of detected incidents, sorted by order of appearance. An entry in this list has the following structure:
| Severity | Time | Classification | Message | Connection |
|---|---|---|---|---|
| This is denoted by the color on the left hand side of the row. | The packet timestamp of the offending packet. | A normalized name for the type of incident that occured. | A more detailed description of the incident | A diagram of the connection in which the incident occured. The IPs can be clicked to go to the IP detail page, and on the right there is an "external link" icon that opens the connection details page in a new tab. |
Additionally, on the right hand side of the modal is another color band that serves as a rough overview over all incidents. The band is static and roughly aligned with the scroll bar to make it easier to navigate to specific severity incidents.
Snort works by reading a rule file which contains a list of rules used to match packets against. These rules can match subnet, direction, protocol, payload contents, and more (see the Snort documentation for more information on rules), and are given a classification, message and priority, which are displayed in the analysis results. Internally this feature uses a community rule set which is available for free and receives periodic updates. Note: The Allegro Network Multimeter (currently) does NOT automatically update this rule set. We are deploying the same rule set to all devices independent of the date of installation. Thus the analysis may not be able to detect zero day exploits and should not be relied on when trying to detect recently discovered attack vectors.
At the moment, only critical and severe incidents are reported (Snort priorities 0 and 1). The classification and message strings are taken directly from the rule that triggered this incidents.


