Back-in-Time functionality: Difference between revisions
No edit summary |
No edit summary |
||
| Line 5: | Line 5: | ||
{| | {| | ||
| | | | ||
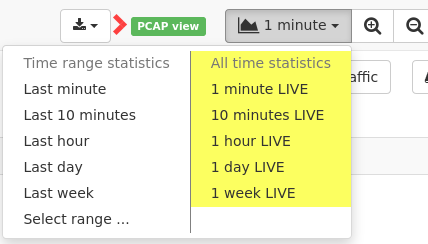
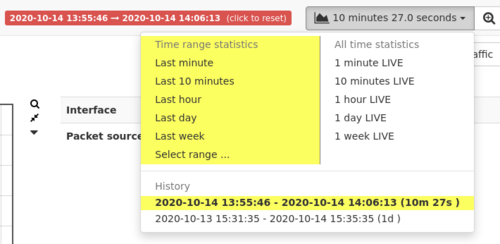
: [[File:time_dropdown_unselected.png|430px|Selecting time span|border]] :[[File:time_dropdown_set.png|500px|Selecting time span|border]] | : [[File:time_dropdown_unselected.png|430px|Selecting time span|border]] :[[File:time_dropdown_set.png|500px|Selecting time span|border]] | ||
|} | |} | ||
| Line 28: | Line 28: | ||
IPs that are not active during the time window are not shown. | IPs that are not active during the time window are not shown. | ||
The '''back-in-time''' mode can be exited by clicking on the red '''back-in-time''' box on the top of the web interface. The Allegro Network Multimeter will switch back to the live view. | |||
Note that even in '''back-in-time''' mode, the device still measures every packet going through it so you will not miss any data. | |||
=== Data not available in back-in-time mode === | |||
Some data is not available for a specific time period in the back-in-time mode, but only as a total value since the start of the measurement. | |||
The | The web interface highlights all data that is not available with a Gray background. | ||
This allows to still read the data while still knowing which data is from the time window and which data comes from the latest measurements. | |||
Revision as of 10:45, 8 August 2024
The Allegro Network Multimeter allows for accessing older data to debug network issues that happen sporadically or are already over.
On the top bar you see either a green LIVE box or a red back-in-time box indicate whether live data is shown are (fixed) data from the past.
In the latter mode, the start and end time is shown as well.
You can click into any history graph shown in the web interface to go back to the corresponding time under the mouse pointer.
The time window is also halved on every click to be able to zoom into specific network events.
A lot of data is available for any specific time frame, such as the amount of traffic processed for an IP address.
But not every single data set is available in the back-in-time view due to memory constraints to store all data.
Also, the resolution of data decreases with new data arriving.
For instance, data for the last minute is always available in one second resolution, while older data might be only available in two second resolution or larger.
Network problems within smaller time spans can still be debugged since absolute counters will still show any network traffic happened between time intervals.
The time constraints applied depend on the context of the data. For instance, IP lists are filtered so that only IPs that had activity before and after the time window.
IPs that are not active during the time window are not shown.
The back-in-time mode can be exited by clicking on the red back-in-time box on the top of the web interface. The Allegro Network Multimeter will switch back to the live view.
Note that even in back-in-time mode, the device still measures every packet going through it so you will not miss any data.
Data not available in back-in-time mode
Some data is not available for a specific time period in the back-in-time mode, but only as a total value since the start of the measurement.
The web interface highlights all data that is not available with a Gray background.
This allows to still read the data while still knowing which data is from the time window and which data comes from the latest measurements.

