HTTP module
The HTTP module processes HTTP traffic and stores the requested host names of the HTTP requests internally for cross-referencing so that name lookup is possible for an IP even if no DNS name has been seen for it. Since a server may handle multiple so-called virtual hosts, multiple names can be seen as well for an IP. The HTTP modules stores all names for each IP which helps seeing which servers in the network handle which specific service. The available information is:
- HTTP host name: This identifier is set by the client of a connection to indicate which specific virtual host the user wants to connect to.
- The HTTP module also stores the response times for HTTP requests and calculates a score value for the HTTP servers based on a simple scoring algorithm.
Web interface
The web page of the HTTP module uses three tabs for showing all available information. At the top of the page, you will find a button which links to this documentation and a thrashcan button to clear all the statistics.
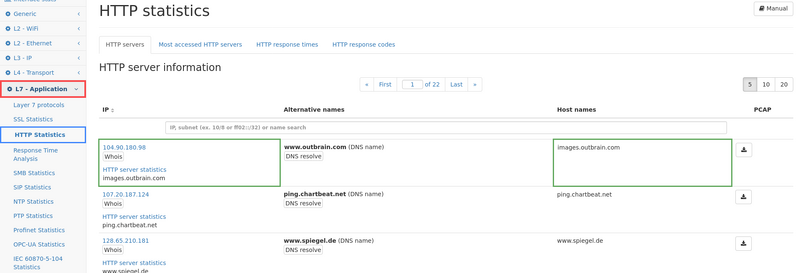
HTTP servers
The first tab HTTP servers shows a list of all IP addresses for which HTTP information could be retrieved. The table of IP addresses contains a search bar where you can enter an IP address or string which is matched against all name fields. This makes it possible to search for a specific IP or to find all IP addresses involved for a given host name. The columns are as follows:
- IP address (see Common table columns - IP): This is the IP address for which HTTP information has been seen. Clicking on it will lead to the IP module page of the same IP address.
- Alternative names: All known names for that IP address are shown in the column. This includes the DNS name, DHCP name, and SSL names, if available.
- Host name: As described above, this is the name requested by the client. Since an IP may host multiple services, all seen names are listed here.
- Capture: The capture button allows to directly capture traffic for the corresponding IP address.
Most accessed HTTP servers
The second tabs shows the top list of all accessed HTTP servers, showing the most accessed server first. The list contains the number of requests, the IP (with a link to main server list filtered for that IP), the country of that IP, and alternative names known for this IP.
HTTP response times
The third tab shows global statistics of all HTTP requests and a list of all HTTP servers for which response times could be calculated. The global statistics contains:
- Number of HTTP responses: This is the total number of requests/responses that have been seen on the network.
- Average response time: This is the average response time in milliseconds for all servers.
- Standard deviation: This value shows the variation of the response times (https://en.wikipedia.org/wiki/Standard_deviation)
- Minimum response time: This is the smallest response time seen on the network.
- Maximum response time: This is the largest response time seen on the network.
Next to the global statistics, there is a summary about the number of servers with good, bad, or medium response quality. The table is split to local servers (those within private networks) and global servers (all the rest).
The green plus symbol contains all servers with a quality score of 4 or more, the orange symbol covers all servers with a quality score between 3 and 4, and the red minus symbol covers all servers with a quality score of less than 3. The list of servers below can be sorted for the quality value to view the relevant servers from each category.
Below the global statistics there is a graph for historical data for HTTP response times.
The data points are the average response time in the given time window (depending on the zoom level), and the top and bottom line shows the maximum and minimum response time in that time frame.
Below the graph there is the list of all HTTP servers with the following columns:
- IP (see Common table columns - IP): The server IP. Clicking on it leads to the connection view of the IP module which allows to see the actual connections with the response times.
- No of requests: The number of HTTP requests/responses seen for this IP address. The number can be higher than the number of HTTP flow in case HTTP keep alive is used and multiple requests are transferred via a single connection.
- Avg response time: This is the average response time for this IP address.
- Deviation: This is the standard deviation for all response times of this IP address.
- Min response time: The minimum response time in milliseconds.
- Max response time: The maximum response time in milliseconds.
- Score: The score is a value between 1 and 5 describing the quality of the HTTP server. 1 means the worst quality, 5 means the best quality. The value is calculated based on a scoring algorithm.
- The score allows to quickly sort for quality and identify bad performing servers.
- Alternative names: The column contains other names for this IP address, from whatever name source that is available (DNS, DHCP, ...).
HTTP response codes
The fourth tab shows global statistics about each family of HTTP response codes. It shows the number of responses with the code family and a pie chart with distribution. The list of IP addresses (see Common table columns - IP) shows the number of return codes individually allowing to sort for server with a high number of error codes.
