Quickstart
Jump to navigation
Jump to search
The Allegro Network Multimeter uses an easy-to-use web interface that allows for exploring different network parameters of live traffic or historical traffic analyzed previously.
The website is split into three sections:
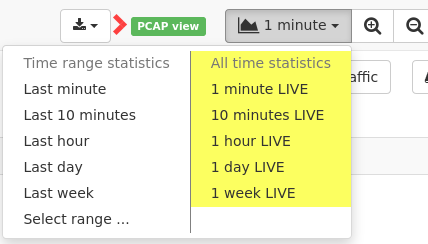
- The top bar shows buttons to change the time resolution of any graph shown in the web interface. You can zoom in or out or select specific timeframes to check the last minute or day, or any other time span. The zoom menu allows you to select either a live view for a selected zoom level or a fixed time range from the past.
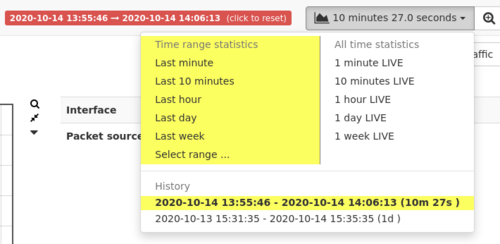
- The green or red box to the left of the zoom buttons indicate whether the currently displayed data is live data or, if the back-in-time mode is active, displaying data over a specific timeframe (whose start and end time is shown inside the box). Click the red box again to return to the live view.
 :
:


- In the live mode, traffic values are so called "all-time" values which means the counters represent the quantity of packets/bytes seen from the start of the device. In the back-in-time mode with an interval from the past, the traffic values represent only that specific time range.
- The Allegro Network Multimeter separates the measurement of network traffic from the actual presentation of the results. This means that you can navigate the web interface, filter lists and use the back-in-time feature any time without losing information from the current network traffic.
- The left side of the web page contains the menu to access different network measurement modules, on L2 - Ethernet layer, on L3 - IP layer, on L4 - Transport layer or on L7 - Application layer.

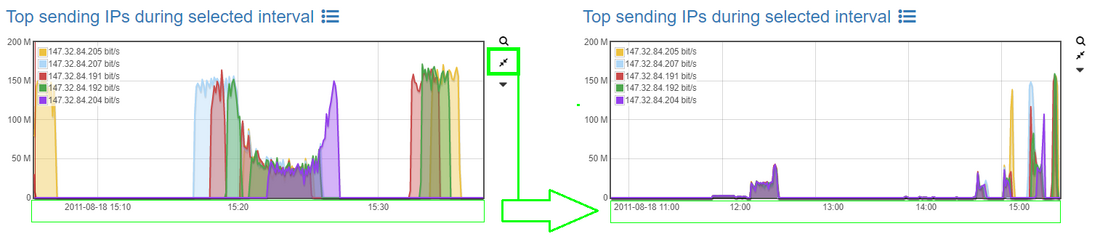
- Whenever you are looking at a trending graph of any particular statistic (top talker, specific IP, specific protocol, individual connection, ...) and you want to snap to the first-to-last byte seen for this particular traffic, simply click on the two diagonal arrows pointing towards each other at the top right hand side of a graph. This will zoom/snap the web-interface to depict the time from when the first byte of that traffic were seen until the last time at which such traffic was seen.
- Whenever you are looking at graphs and see something of interest, e.g. high handshake time at a certain point in time...you may simply focus in on the specific time-frame by selecting (left mouse) that part of the graph. The Alllegro's web-interface will now zoom in and snap to the selected time-frame. While doing so, the Allegro Network Multimeter instantly recalculates cumulative counters and averages applicable to the selected time-frame. Also, every device, connection, protocol (...) that was NOT active during the selected time-frame, is already conveniently filtered and not displayed to you.
- The remainder of the User Interface tabs contain the actual network parameters depending on the sub page you are viewing. Each measurement module uses links to access data stored in different modules. For instance, the MAC overview shows IP addresses seen for a specific MAC address; clicking on it will lead to the IP specific site of the IP measurement module. Many measurement modules show lists of elements such as IP addresses or connections. Such lists can be filtered for multiple parameters and sorted for different columns. There are individual manual pages for each measurement module which can be accessed by clicking on the question mark button.
