Introduction
The Allegro Network Multimeter is a real-time network measurement tool to identify network problems, performance bottlenecks, and to measure network quality parameters. It can be used for network troubleshooting, performance measurement, performance monitoring and other use cases. The appliance is easy to install and provides a modern web-based interface to analyze multiple network traffic parameters from all Layers of the network stack.
The appliance can be placed inline in gigabit networks, or running on the Mirror Port of a router. It will measure the following network parameters:
- Layer 2 statistics & analysis MAC, QoS, ARP, VLAN, STP, MPLS, LLDP, PPPoE, packet size distribution and Micro burst analysis.
- Layer 3 statistics & analysis Individual IP, QoS, DHCP, DNS, Netbios, ICMP, Multicast and Geolocation.
- Layer 4 statistics & analysis TCP, IPSec, individual connections and L4 server ports.
- Layer 7 statistics & analysis SSL, HTTP, SIP, RTP, SMB, Profinet, OPC-UA, L7 app. protocols, NTP, PTP and custom response time analysis.
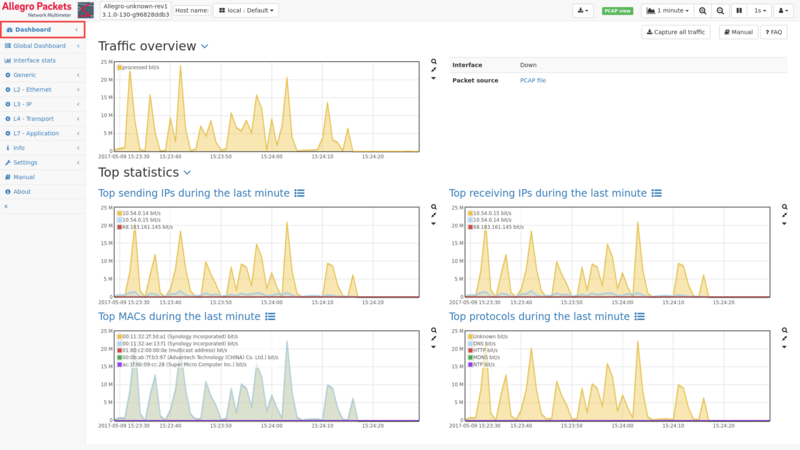
All information is available in Real-Time including history graphs of the global traffic, traffic per MAC address, per IP address, or even per protocol. Additionally, graphs can be clicked to zoom into a specific timeframe and see measurement results for only that specific time interval.
Data processing and storage
The Allegro Network Multimeter consists of two different and completely separate types of memory where data is being processed (RAM and Storage), which facilitates different modes of operation.
1. Allegro Network Multimeter uniquely utilizes Random Access Memory (RAM) to construct its very fast In-Memory Database. Measurement data and statistics shown throughout the web-interface/dashboard, are stored in, and retrieved from RAM. This allows for the Allegro Network Multimeter to be used in restricted and GDPR/AVG sensitive areas, where it is not allowed to store or remove data. Statistics and data shown in the dashboard will be gone in event of a power cycle.
2. Allegro Network Multimeter facilitates the use of a so called Packet Ring Buffer. The packet ring buffer (see Storage) is a HDD/SSD storage device where packet data can be stored "permanently". This allows Allegro Network Multimeter users to retroactively extract packets of interest from the web-interface. In depth analysis of such extracted pcap file can be done either with Allegro's built in Webshark or with Wireshark.
The use of a packet ring buffer also allows to easily replay network traffic (or parts thereof) that was captured to the storage device. So for instance, an engineer could send out a portable Allegro Network Multimeter to a remote site/customer, have the Allegro Network Multimeter collect network traffic for multiple days and replay & analyze this data afterwards. Packet broker type filters can be set for the In-Memory Database and the packet ring buffer.
Dynamic memory utilization
The Allegro Network Multimeter dynamically adjusts its memory usage to the traffic it sees. This means that in smaller networks with few IPs and connections, the analyzer can store historical data longer than in larger networks with far more IP- and connection information.
The Network Multimeter will automatically remove old data from memory (FiFo) if the memory usage is above 90%. Under "Info" in the web interface's menu, the "System info" page shows the current usage and, more importantly, for which period of time data is available.
A high memory usage is usually not a problem as the device will not remove any measured data unless the limit of 90% is reached. So over time, 90% of the memory will be used. The type of traffic has a great influence on how long data can be accessed.
In a situation where the memory usage keeps increasing to 100%, the Analyzer is overloaded. This basically means that for that traffic load or situation, a larger Allegro Network Multimeter is required.
By default, all graphs will display recent network traffic with a 1 second resolution. For older traffic the graph resolution will dynamically be lowered e.g. up to 16s. It is possible to adjust the aforementioned graph resolution and reduction values in the settings, to either get more detailed graphs OR a longer period of data & statistics available in the dashboard.
Name correlation
The Network Multimeter will display "Name information" whenever available. Different data sources are used for extracting such name information from network devices and their respective IP addresses. Name information is often announced by the device itself (via DHCP or NetBIOS), or as part of the network infrastructure (via DNS or HTTP host names).
All information is gathered during runtime and shown for each IP address to make it possible to identify the actual system parameters.
Depending on the network setup, the same IP can be assigned to different devices over time. The Allegro Network Multimeter will show as much name information as possible even if such information is outdated. This means that it can occur that a name is displayed for an IP address that actually belongs to a different device. This is not really a problem, since new devices (should) announce their name regularly, which will bring the internal name database up to date again.
