L7 module
The L7 module operates on results provided by the layer 7 protocol classification engine. This includes information on how much traffic for each protocol was seen for each IPv4 and IPv6 address. For each protocol the corresponding network traffic is accounted and a list of IP addresses for which the protocol was seen is available. It is also possible to extend the layer 7 protocol list by configuring custom protocols based on IP addresses or ports. This allows to track or filter specific IP or IP subnets or specific ports.
Web statistics
L7 protocols
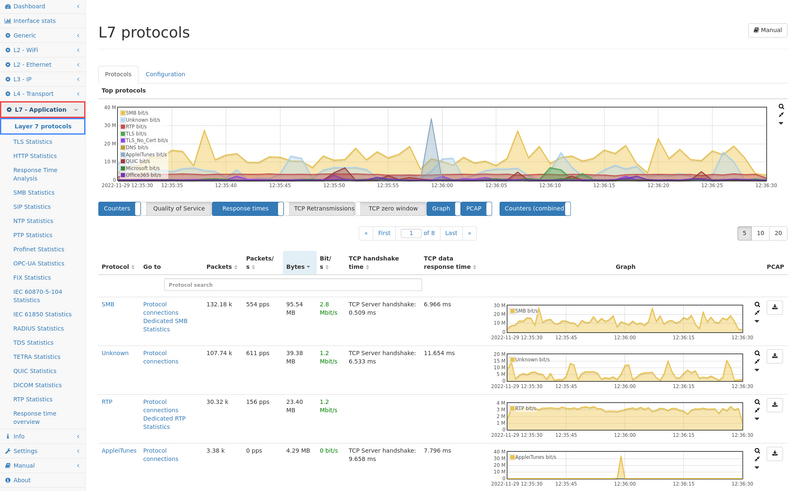
A history graph sits on top of the page containing the top 10 protocols that created the most traffic. Below the history graph the protocols are listed with the following information available for each of them:
- Number of total packets
- Current throughput in packets per second
- Number of total bytes (counting full ethernet frames)
- Current throughput in bytes per second
- A list with the Top 5 QoS classes seen for that protocol
- A graph showing throughput history
- A button to trigger a packet capture including only traffic for that protocol (see Capture module)
When multiple pages of protocols are available, there will be a control field for switching pages in each list. The protocol search bars allow for entering names to see only those element for which the entered string is part of the name. The lists are sortable by most of the columns. Protocol names are linked to the respective detail views which are explained below.
Statistics for protocol
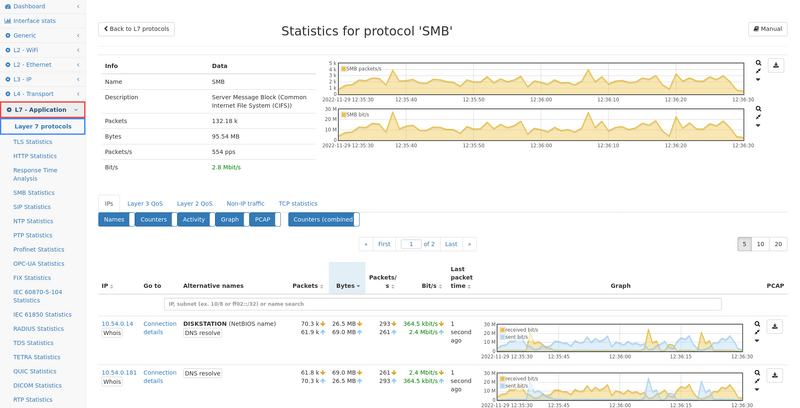
These detail view page show statistics for a specific protocol. On the top left they contain a table with the following information:
- The full name of the protocol and its verbose description
- Number of total packets
- Number of total bytes (counting full ethernet frames)
- Current throughput in packets per second
- Current throughput in bytes per second
On the top right they show two history graphs of which the upper one show packet throughput history while the lower one shows byte throughput history. On the bottom of a detail view page there are tabs to choose between the list of IP addresses, layer 3 QoS and layer 2 QoS classes seen for that specific protocol.
IPs
In this tab there is a table listing all IP addresses that have sent or received traffic of that particular protocol. The table contains the following information:
- The IPv4 or IPv6 address (linked to the respective Per IP statistics view of the IP module)
- Alternative names for the IP address like DNS name or DHCP names
- Number of total packets for that IP and protocol
- Number of total bytes for that IP and protocol (counting full ethernet frames)
- The time of the first packet for that IP and protocol
- The time of the most recent packet for that IP and protocol
- A button to trigger a packet capture including only traffic for that IP and protocol (see Capture module)
- A graph showing throughput history for that IP and protocol
When multiple pages of IPs are available, there will be a control field for switching table pages. The IP/dns/dhcp search bars allow for entering IP addresses or names to see only those element for which the entered string is part of the IP or dns/dhcp name.
The table is sortable by most of the columns. IPs are linked to the respective Per IP statistics view of the IP module.
Layer 3 QoS
For layer 3 IP differentiated services codepoint (DSCP) are displayed in a table with traffic counters, a history graph of traffic over time and a PCAP button for that certain DSCP value. More information about QoS can be found in QoS module.
Layer 2 QoS
For layer 2 VLAN priority code points and MPLS traffic classes are analysed and displayed in a table with traffic counters, a history graph of traffic over time and a PCAP button that certain QoS tag. More information about QoS can be found in QoS module.
TCP statistics
This page shows the TCP Application time of the Protocol like the TCP statistics of an IP address.
Configuration
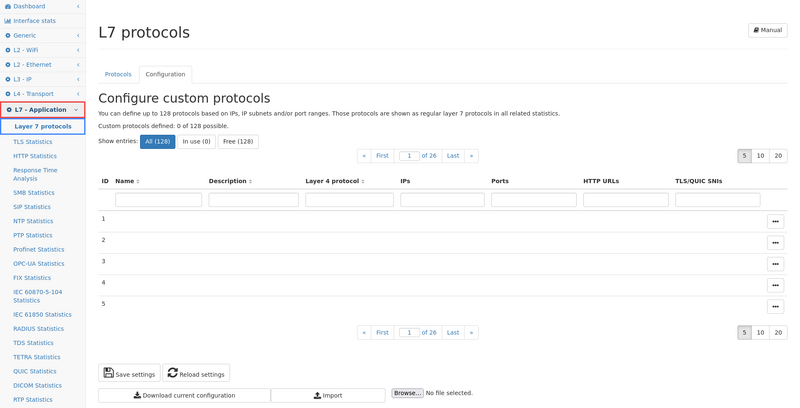
The configuration tab allows to define additional custom protocols. Based on IP addresses or subnets or port ranges, up to 128 different custom protocols may be defined which are shown as regular layer 7 protocols in the statistics described in the previous sections. These custom protocols can be used to track specific services or IP addresses. It also possible to capture traffic specific to those protocols or define filters.
Keep in mind that statistics are always accounted regarding their protocol ID so when changing a configuration for a specific ID, all previous statistics for that ID will still be available even if the IP/port combination would not have matched on the old traffic. It is recommended to restart the packet processing after modifying existing definitions.
Each protocol consists of the following parameters:
- Name: this is the identifier used in all statistics and layer 7 specific filters. An unique name must be chosen.
- Description: the description is purely informational and is shown in the detailed statistics for that protocol. This field can be used for a detailed description what kind of traffic the protocol covers.
- Layer 4 protocol: The protocol may match any IP traffic but also can be limited to just TCP or UDP traffic. For performance it is recommended to choose either option if this is applicable as only part of the traffic need to be checked against the other matching rules.
- IPs: An IP address can be entered or a subnet using the subnet size parameter. The source and destination IP address of a network packet is used to match the list of IP addresses.
- Example values are:
- 1.2.3.4
- meaning exactly the IP 1.2.3.4
- 1.2.3.0/24
- this matches any IP between 1.2.3.0 and 1.2.3.255
- It is possible to use IPv4 or IPv6 addresses.
- Up to 16 IP addresses may be used so that at least one item on the list must match.
- Ports: TCP or UDP ports may be used to match traffic. The source and the destination port is used to match the list of ports. Individual ports or port ranges can be used.
- Example values are:
- 80
- meaning exactly port 80
- 100-200
- matches any port between 100 and 200
- Up to 16 ports or port ranges may be defined.
As of firmware 4.5:
- HTTP URL: A HTTP hostname or fully qualified URL or parts of it can be specified. The configured URL will be be treated as a regular expression.
- TLS/QUIC SNI: Server name indication of TLS handshake (client hello). The given name will be treated as a regular expression. Example: example\.com, domain(365){0,1}(\.com|\.net)
Either IP addresses or ports may be left empty, but if both are defined, they must match together. So for a specific packet the source or destination IP must match any entry in the list of IP addresses and the source or destination port must match any entry in the list of ports.
Examples
- To define a custom protocol for an internal web server at IP 10.2.0.1, use the following settings:
- Name: int_server_1
- Layer 4 protocol: TCP
- IPs: 10.2.0.1
- Ports: 80
- To define a custom protocol for a complete subnet 10.3.0.0 - 10.3.0.255, use the following settings:
- Name: office_computers
- Layer 4 protocol: Any layer 4 protocol
- IPs: 10.3.0.0/24
- Ports: none


