MAC module
The MAC module operates on layer 2 of the network stack. It stores information about all MAC addresses. For every address, the corresponding network traffic is accounted, the used protocols and their individual traffic. The communication MAC peers are stored as well as the traffic between both MAC addresses.
MAC addresses
Section titled “MAC addresses”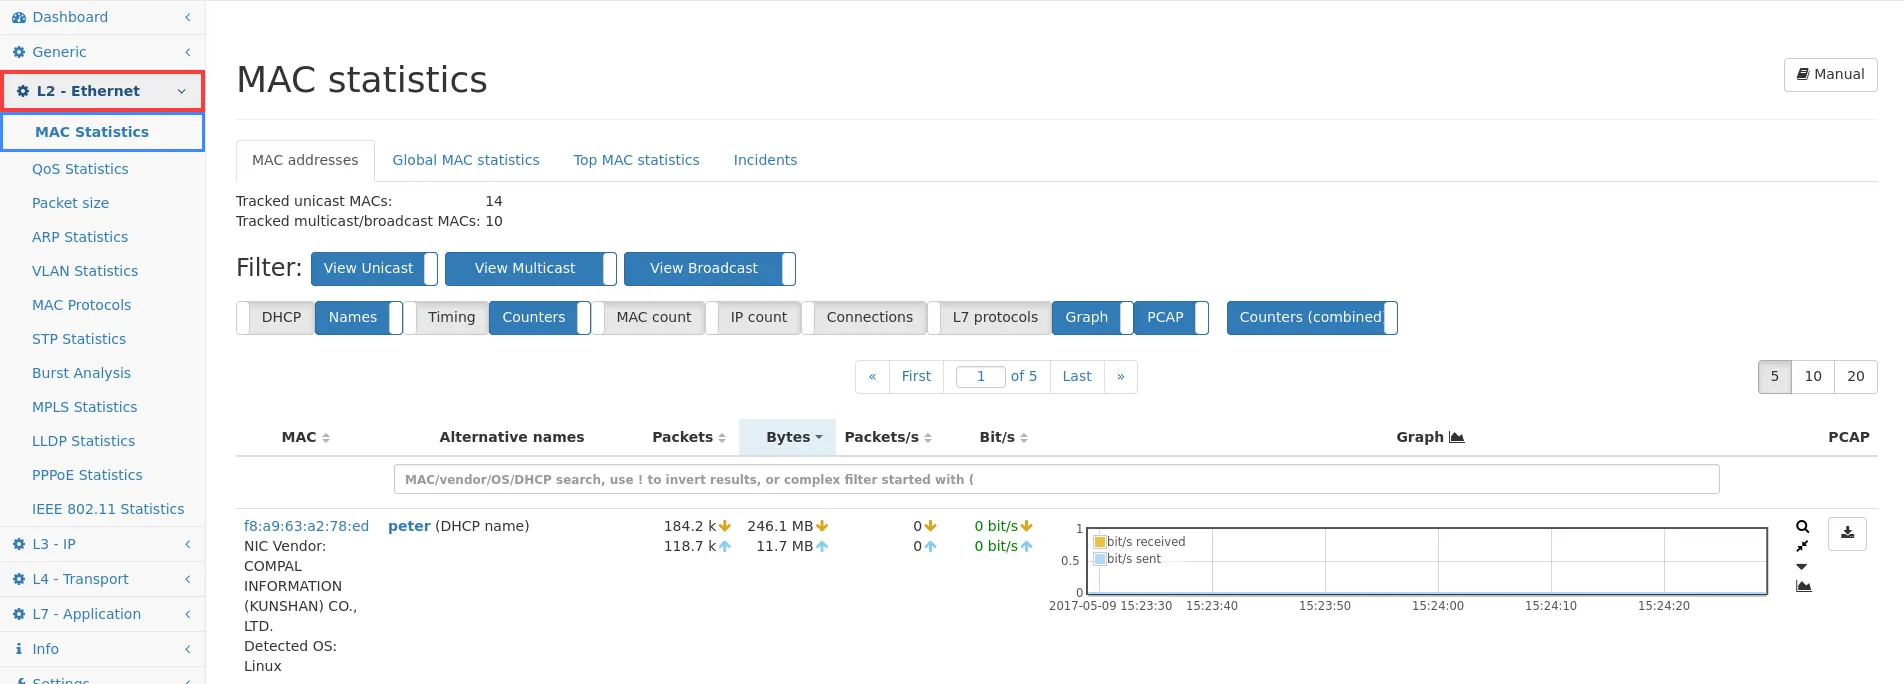
The button row allows for enabling and disabling specific columns so that only the relevant information fit onto the display. By clicking on Counters (combined) the table toggles between sent and received bytes and packets displayed in either one column or in separate columns for sorting purposes. The list contains all MAC addresses seen by the system. For each address, the table contains the following information:
-
MAC: The MAC address with additional information like the NIC vendor or detected OS. The address can be clicked to reach the detailed page for additional information for that specific MAC address.
-
NIC vendor: The NIC vendor name as specified in the IEEE OUI assignment. Be aware that some MAC addresses are defined globally and do not belong to any vendor like broadcast or multicast addresses.
-
Detected OS: A list of all detected OS that are mapped behind this MAC address. The OS is detected by host specific layer 7 patterns. This information can be used to search or identify specific systems. Be aware that routing and NAT allows more than one OS behind one MAC address.
-
DHCP host name: The DHCP name is passively extracted from the DHCP request. It can be used to identify specific systems with the DHCP name, like printers etc.
-
First (recent) activity: This columns shows the first time when this MAC showed activity for the first time or after a long time of inactivity.
-
Last activity: The last activity is the last time a packet has been received or sent by the MAC address.
-
Packets and Bytes: This is the number of packets and bytes, received by the MAC address as a yellow arrow down, and the sent bytes as a blue arrow up.
-
Packets/s and Bit/s: These two numbers describe the current throughput of this MAC address, for down- and up-link.
-
MAC peer count: Number of MAC addresses which have sent or received packets from this MAC address. The counter is increased at the first packet between 2 MAC addresses. It is decreased after the global timeout for no activity between 2 MACs has been exceeded.
-
Active IP count: Number of IPs mapped behind this IP address. The counter is increased at the first packet for an MAC/IP pair. It is decreased after the global timeout for no activity for a MAC/IP pair of 2 MACs has been exceeded. This number can be very high for routers, NAT gateways or similar as they can map millions of IPs to one MAC address.
-
Open connections: The numbers describe the number of currently open connections and the maximum number of connections open (simultaneously).
-
L7 protocol: This column lists all seen L7 protocols for that particular MAC address. The Top 10 protocols are shown by default. The view can be toggled to show all by clicking on it.
-
Graph: The column shows the history graph of the traffic for each MAC address. The resolution can be changed by using the control buttons on the top of the web page. The graph icon allows for selecting different graph types such as load (bps or packets/s) or connections.
-
PCAP: See Common table columns - PCAP.
When multiple pages are available, there will be a control field for
switching pages. The MAC search bar allows to enter MAC addresses or
names to see only those elements for which the entered string is part of
the IP address, NIC Vendor name, the operating system or DHCP host name.
Also, complex filter expressions are possible, if the string starts with
an open parenthesis (. See Live filtering of
tables for a
detailed description about how to use this feature.
The columns can be sorted also, for example to easily spot the MAC addresses with the most bytes, or the highest current throughput.
Detailed MAC Statistics
Section titled “Detailed MAC Statistics”For each MAC address, a more detailed view can be opened by clicking on the corresponding MAC address on the list of all MAC addresses. The header line contains buttons to return to the main MAC view, to download traffic for this specific MAC address and to access this documentation.
Overview
Section titled “Overview”The Overview tab contains graphs for both packet and bit rates of the MAC address. The tables below show raw data for the current throughput and the total packets/bytes processed, also split for IPv4, IPv6, and non-IP packets. The next rows contain additional statistics about the MAC. The number of IP addresses seen behind that MAC address leads to the Active IPs tab, while the MAC peers number leads to the MAC peers tab.
The Open connections row contains a graph showing the history of the number of open connections. As for any graph in the web interface, the resolution can be changed with the time buttons at the top of the page.
Layer 3 Protocols
Section titled “Layer 3 Protocols”The Layer 3 protocols tab lists all MAC protocols seen for this MAC address with parameters like bytes and packets. The First packet time is the time of the very first packet that has been identified as the corresponding protocol for this MAC address. Analogously, the Last packet time is the time when the last packet has been seen for the protocol. The graph shows the complete history of that protocol for the MAC address. The capture button allows for capturing traffic for the MAC and protocol combination.
Layer 7 Protocols
Section titled “Layer 7 Protocols”The Layer 7 protocols tab lists all DPI protocols seen for this MAC address with parameters like bytes and packets. The First packet time is the time of the very first packet that has been identified as the corresponding DPI protocol for this MAC address. Analogously, the Last packet time is the time when the last packet has been seen for the protocol. The graph shows the complete history of that protocol for the MAC address. The capture button allows for capturing traffic for the MAC and protocol combination. The protocol name in the first column can be clicked to reach the L7 module for that protocol.
Active IPs
Section titled “Active IPs”The Active IPs tab lists all IP addresses that have been seen behind the MAC address. For routers the list usually contains a lot of IP addresses (like all external IP addresses), while for internal MAC addresses of client computers, the list usually contains only one or a few IP addresses. Multiple addresses may happen if IPs are dynamically assigned to client computers. The table contains all known alternative names from different sources such as DHCP or DNS resolving. The first and last packet time describe the time when the IP appeared first for this MAC address, and has been used last. These values allow for identifying which IP address might be in use at the moment. The capture button allows for capturing traffic for the MAC and IP address combination.
MAC peers
Section titled “MAC peers”The table contains all MAC addresses the current MAC address has sent packets to or received packets from. The vendor and DHCP name are shown (if available), helping identifying the system behind that MAC address. The usual traffic statistics are shown, including a history graph. The capture button allows for capturing traffic between those two MAC addresses only.
Peer countries
Section titled “Peer countries”Similar to the MAC peers, the countries tab lists all countries to which the current MAC address has sent packets to (or received packets from). The country is identified based on the IP addresses seen for the MAC peers. The capture button allows for capturing traffic for the current MAC address and the selected country for any possible peer.
Outer VLANs
Section titled “Outer VLANs”The Outer VLANs tab lists all outer VLAN tags seen for the MAC address, also showing the amount of traffic for which no VLAN tag has been used. The tab contains the usual traffic statistics including a history graph. The capture button allows for capturing traffic for the MAC and outer VLAN combination.
Outer MPLS
Section titled “Outer MPLS”The Outer MPLS tab lists all outer MPLS labels seen for the MAC address, also showing the amount of traffic for which no MPLS label has been used. The tab contains the usual traffic statistics including a history graph. The capture button allows for capturing traffic for the MAC and outer MPLS combination.
Global MAC statistics
Section titled “Global MAC statistics”The tab Global MAC statistics shows the following counters and graphs:
- Total traffic: The total L2 traffic.
- Unicast traffic: The amount of traffic directed to unicast MAC addresses.
- Broadcast traffic: The amount of traffic directed to broadcast MAC addresses.
- Multicast traffic: The amount of traffic directed to multicast MAC addresses.
For each traffic type there is a PCAP button which allows to capture the respective traffic.