Network Burst Analysis
How can you use the Allegro Network Multimeter to quickly and easily detect network bursts and find the related sender and receiver?
Burst detection
Section titled “Burst detection”The Allegro Network Multimeter provides several options to detect bursts.
- You can use the total throughput graph in the Dashboard. This graph aggregates the incoming traffic on all interfaces. The data is displayed with a resolution of one second. A burst that leads to a significant increase of traffic with a long enough duration can be easily seen as a spike.
- You can view the traffic graphs on the Interface stats page. These graphs display traffic per interface and use the same time resolution of one second.
- For an automatic notification when the total bandwidth throughput is too high, you can use bandwidth incidents. They are configured under Generic → Incidents → Incident rules. Just define an incident rule for the Trigger type Global: Traffic and set either an attribute for data rate or packet rate and a severity. The time resolution is one second.
- For a higher resolution of up to 1 ms you can use the Burst Analysis incidents. They are per interface incidents and will be generated when a threshold is exceeded. They are configured under Generic → Incidents → Other settings in the Burst Analysis section.
Interface burst incidents
Section titled “Interface burst incidents”In this example we will use the Burst Analysis incidents to detect bursts and find out who sent the packets.
For back-in-time data capture you can use the packet ring buffer feature.
Under Settings → Modules settings in the Burst Analysis section, we set the duration of the measurement interval to 5 ms. You can set it from several seconds to as low as 1 ms. Under Generic → Incidents → Other settings in the Burst Analysis section, the incident must be enabled by setting the severity to Low and a throughput threshold of 700 Mbit/s.
After several minutes we get a notification and go to the overview under Generic → Incidents → Occured incidents. When clicking on the incident we see details about the burst.
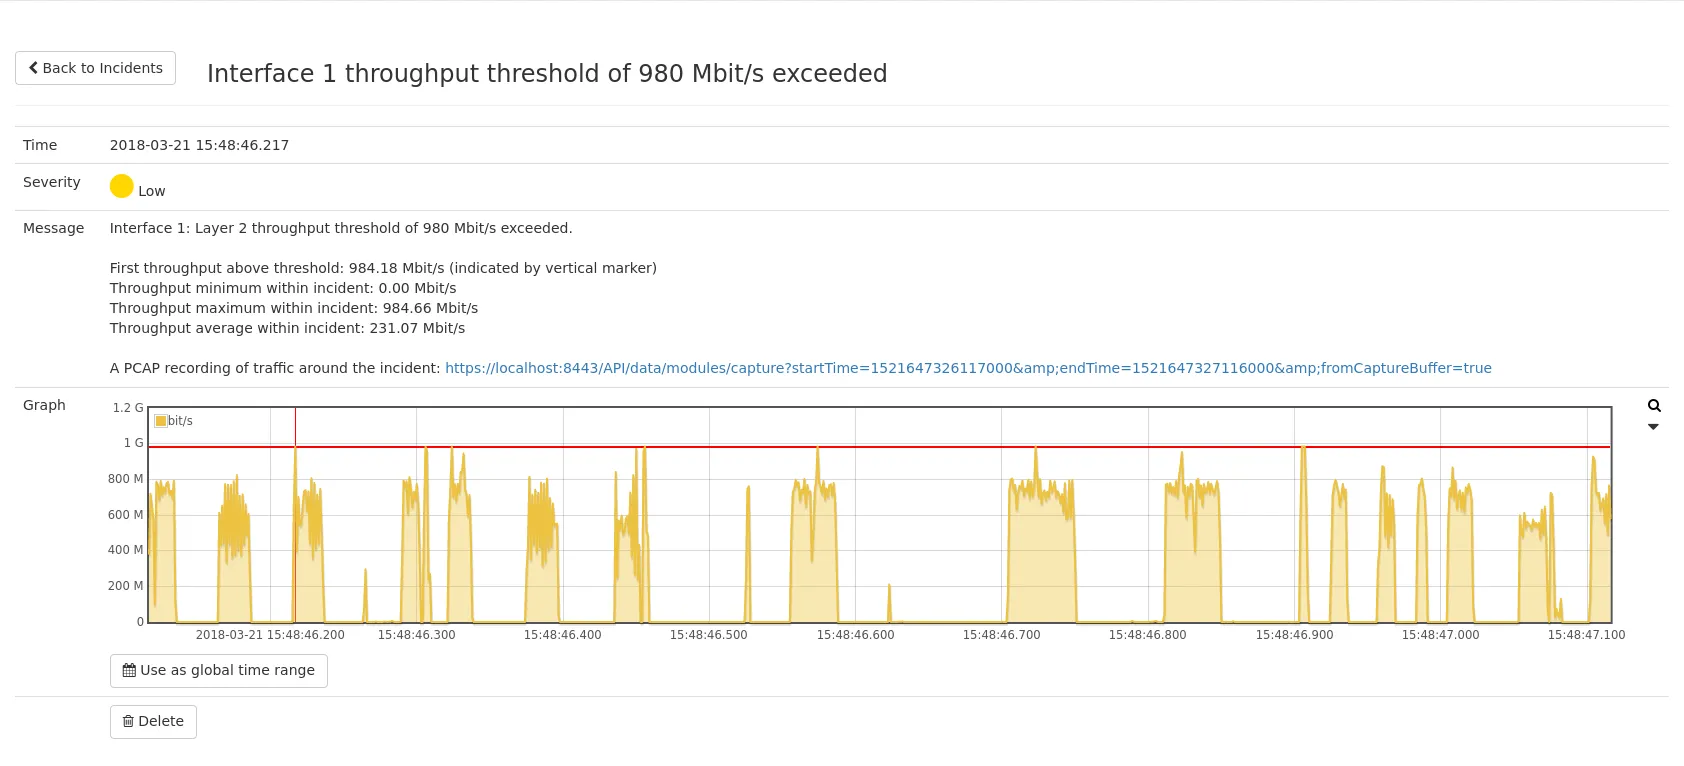
The burst started at 15:48:46.217 and lasted around 5 measurement cycles (25 ms). A PCAP link is available and will offer a capture of the time around the burst for a deep per-packet analysis. Let’s download the PCAP and use it later.
The Use as global time range button allows for setting the global data range around the time of the burst. By using it, all modules in the Allegro Network Multimeter will display statistics and provide captures for this time range. Since we want to analyze the burst we click on it.
What was responsible for the burst?
Section titled “What was responsible for the burst?”Let’s take a look at the Dashboard.
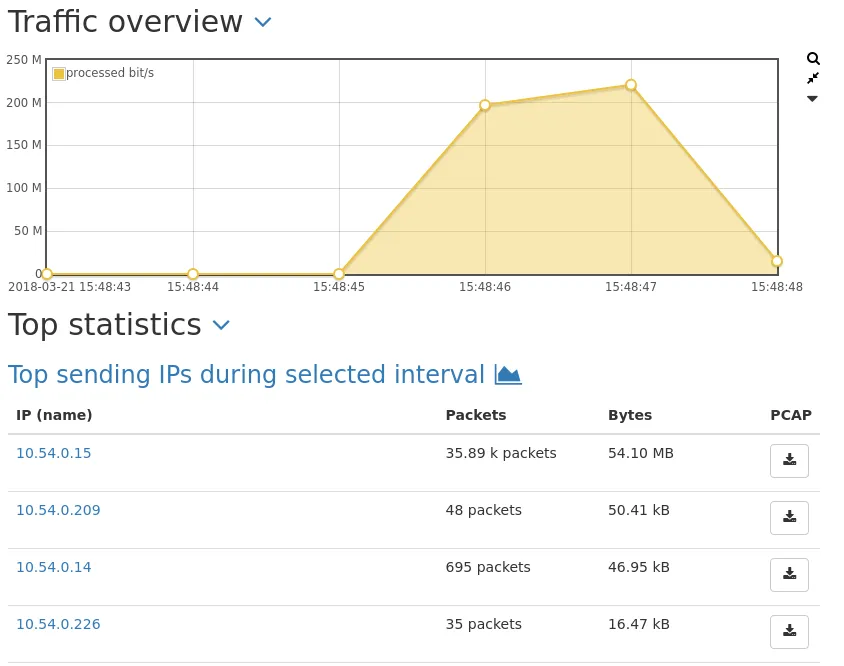
The total throughput graph time resolution is too low to display the same values as in the incident graph. But we get a good overview of the IPs with the most traffic during this time interval. AFP and SSL were the most used protocols. The traffic value of an IP is bi-directional, so a sender and receiver pair would have around the same traffic and can be seen quite easily.
We could assume that any of the top four IP addresses is either the sender or receiver of the burst packets. Though the fifth IP address has a relatively high packet rate compared to the others, the byte count is significantly lower and it is not likely involved in the burst.
You can zoom in and out in all graphs by pressing [Shift] and use the mouse wheel. This will set the global time range and update the displayed graphs and values. After zooming out, you still see the same traffic distribution on the Dashboard.
Let’s check the more detailed IP list under L3 - IP → IP Statistics to get a clearer picture. We want to find out whether the top IP addresses were communicating with each other. Perhaps we can find some pattern in the traffic related to the burst?
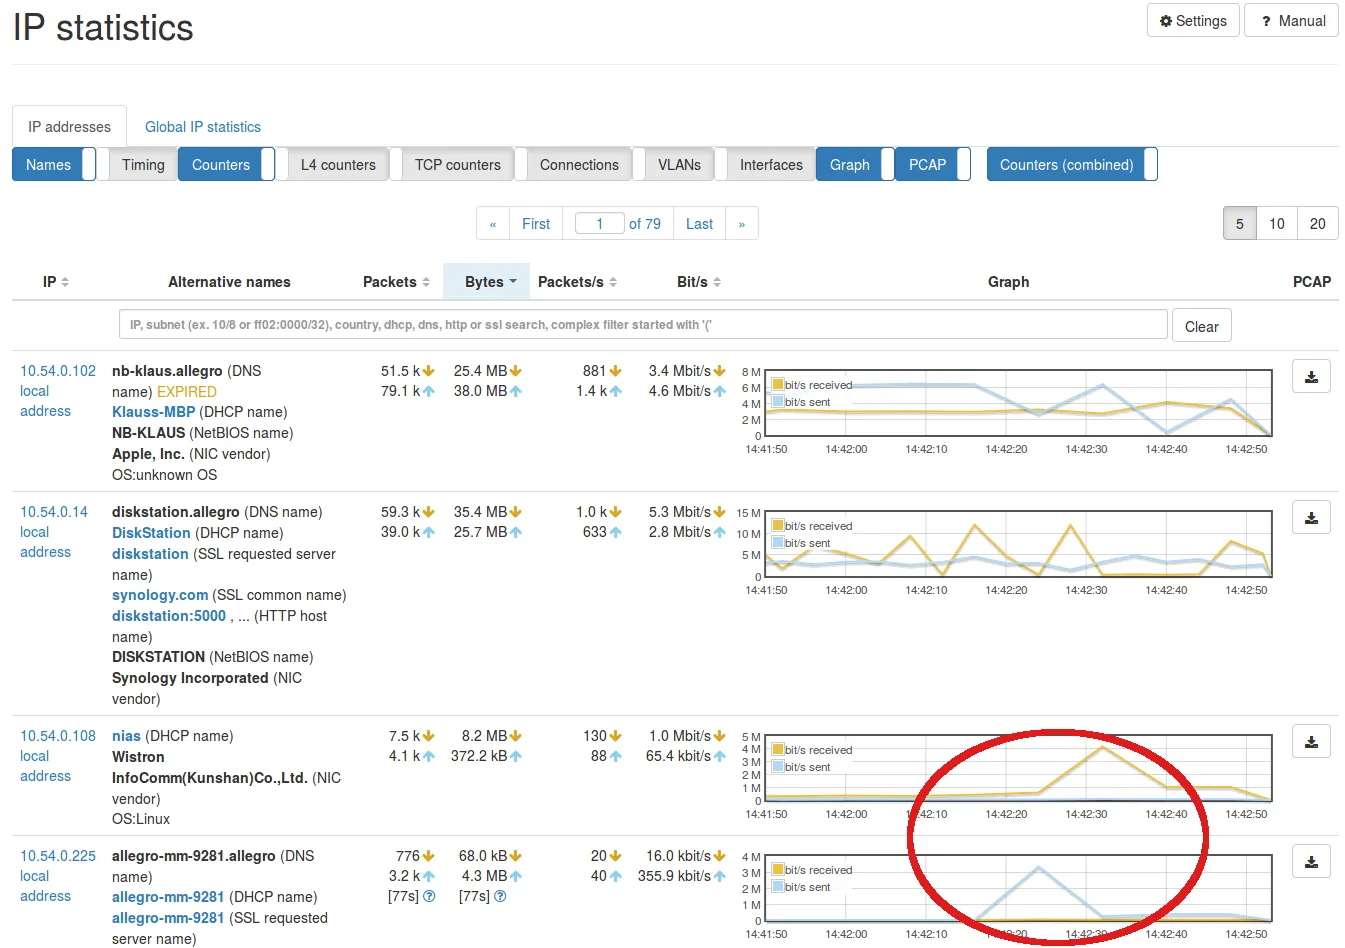
We can immediately see a spike in both IP addresses 10.54.0.108 and 10.54.0.225 around the time of the incident.
Now let’s analyze the IP address 10.54.0.108 by clicking on it and opening the Peers tab:
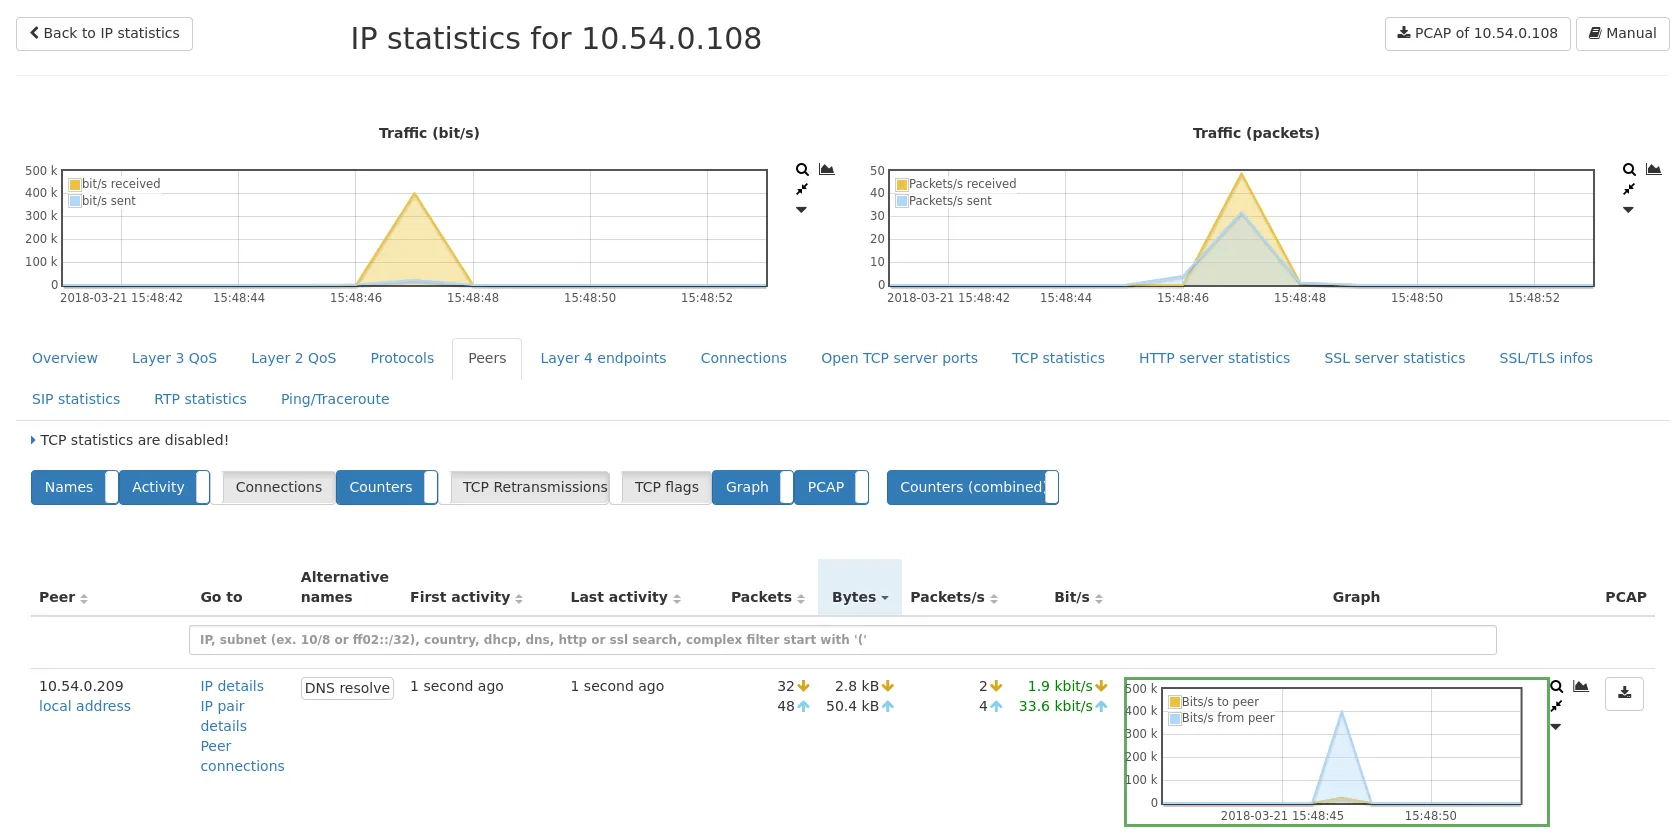
Both IP addresses communicated with each other. 10.54.0.225 suddenly started sending a unusually high number of packets to 10.54.0.108.
We can now check for more details in the PCAP provided by the throughput incident.
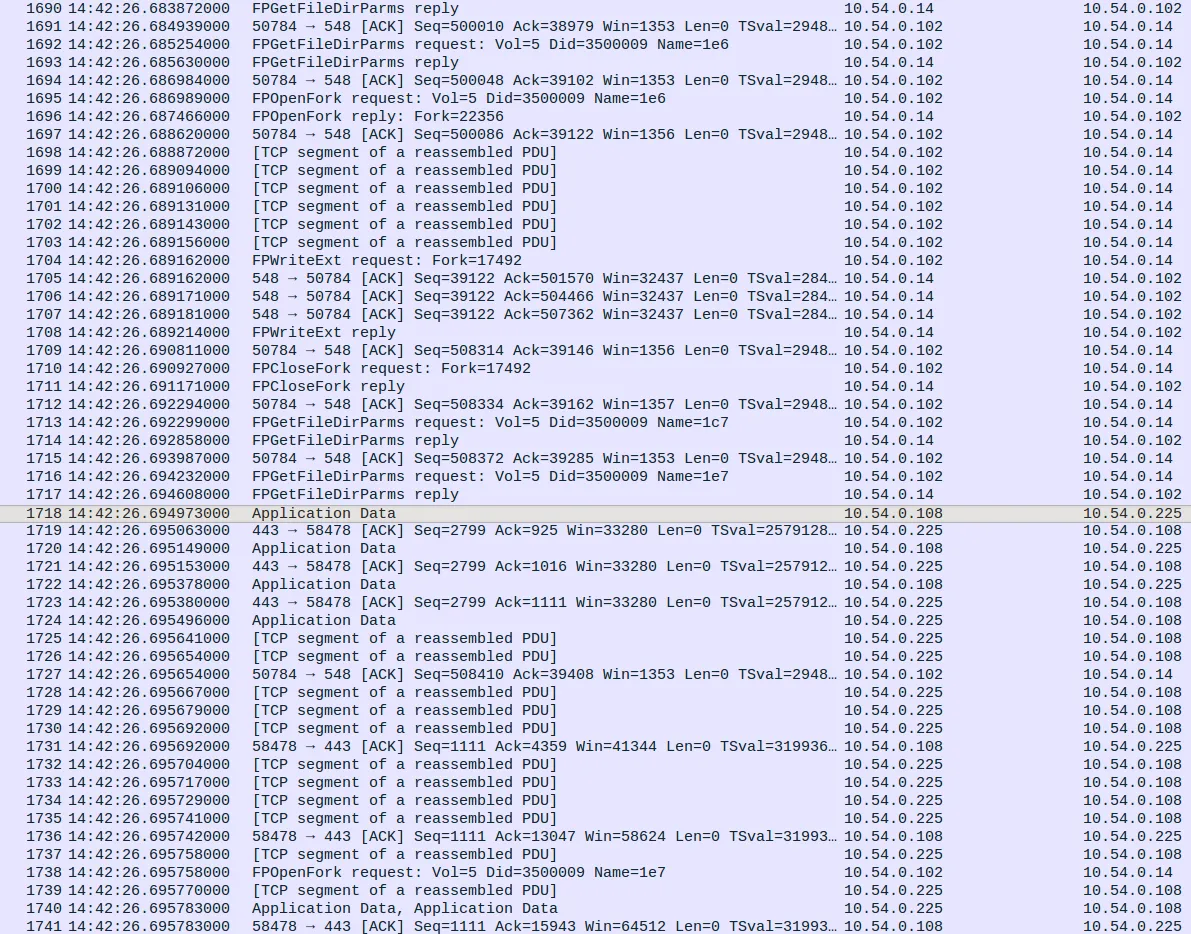
Before the time of the incident, the traffic was significantly lower. At 14:42:26.69497 IP address 10.54.0.108 sent a packet to 10.54.0.225 which triggered the traffic burst.