Process traffic capture from remote device
Overview
The Allegro Network Multimeter can also be switched into a special mode to receive pcap stream via TCP from any remote device. It is possible to process plain pcap files or use an additional tool to capture traffic and send it to the Allegro Network Multimeter.
This mode can be enabled or disabled, and if enabled, the port for receive packet streams can be configured. Be aware that this port is plain unencrypted TCP!
If changes to these settings are made, a restart of the measurement application is required, which can be done in the Administration page.
Every pcap file streamed to the TCP socket will be processed as it would be analysed locally from a connected storage device. Up to 16 connections can be used simultaneously. Since the internal clock depends on the packet time, all clocks of the sources should be (almost) synchronous (for example by using NTP time synchronization).
To analyze a bunch of files chronologically, stream the files one at a time to the Multimeter. The timestamps of the actual packets are used for the internal time clock of the Allegro Network Multimeter so network problems and events can be traced back to the actual time they happened.
The clock of multiple files should not run backwards, i.e. when a file from an older capture time is processed after a file from a newer capture time. If such files need to be analyzed, the measurement core should be started via the Administration page.
The System Info Page shows the current packet processing mode, indicating whether live traffic from local network interface is processed, live traffic from the TCP port, or a pcap file from the storage device is analyzed.
Parallel remote packets
Starting with version 4.3 there is now the option to run the remote packet processing in parallel to the live analysis just like a parallel PCAP analysis or parallel Packet Ring Buffer analysis. For this to work the PCAP parallel analysis feature must be enabled (see PCAP parallel analysis).
In the tab Parallel remote packets the following parameters can be set:
- Port number: the port on which this parallel remote packet processing should listen for incoming connections
- Name: a name displayed on the Top User Dashboard when the replay slot is selected (optional)
- Description: a description displayed on the Top User Dashboard when the replay slot is selected (optional)
- Analysis Profile: a settings profile to be used for the parallel remote packet processing (see Pcap analysis module)
- Replay Slot: the replay slot to be used for the parallel remote packet processing
A checkbox Use a temporary Packet Ring Buffer for the parallel remote packets analysis can be enabled to let the the parallel remote packet analysis use a Packet Ring Buffer on the selected storage device. This Packet Ring Buffer and all its contents will be deleted once the remote packets analysis ends. Selecting this checkbox shows the following additional settings:
- Storage device: the storage device on which to create the temporary Packet Ring Buffer
- Ring buffer size in MB: the size of the temporary Packet Ring Buffer in MB
Once the Start parallel remote packets button is pressed the user interface can be switched between the parallel remote packets analysis and live analysis just like with the parallel PCAP analysis by selecting the respective replay slot. The processing can be stopped in the Parallel remote packets tab or on the Top user dashboard when the replay slot is selected.
Receive packets from remote capture device
Example uses
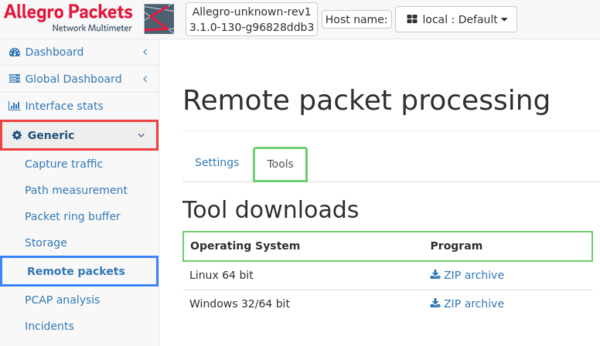
The capturing tool can be downloaded from the Remote packets page in the Generic section.
The tool allows to capture packets from any or a specific network device, and also to stream a file to the Allegro Network Manager:
- Processing a local pcap file:
./ap_capture_to_remote -f trace.pcap allegro-mm-abcd 8001
- Live-capture from eth0:
sudo ./ap_capture_to_remote -i eth0 allegro-mm-abcd 8001
or permit access to network interfaces only instead of full root permissions:
sudo setcap cap_net_raw=ep ap_capture_to_remote
./ap_capture_to_remote -i eth0 allegro-mm-abcd 8001
- Live-capture from all network devices:
sudo ./ap_capture_to_remote allegro-mm-abcd 1234
In all examples, host and port number must be set according to the actual Allegro Network Multimeter device and the configured port number.
To see all available options, execute the program with the argument "-h"
./ap_capture_to_remote -h
Additional notes
- The tool automatically applies a filter to not capture the connection to the remote Allegro Network Multimeter to avoid running a loop when the remote connection is visible on the captured interface. That means no additional actions need to be made to skip the remote capture connection.
- Not all interface types are supported for capturing. The interface must provide either Ethernet frames or WiFi frames.
Alternative tools
The Allegro Network Multimeter also accepts plain pcap files on the configured port. That means it is possible to stream files to the device or use tcpdump with additional filters.
Example uses are:
- Processing a local pcap file:
cat trace.pcap | netcat allegro-mm-abcd 1234
- Live-capture via tcpdump:
sudo tcpdump -i eth0 -s 0 -U -w /dev/stdout | netcat allegro-mm-abcd 1234
Remote capture via ERSPAN
The capturing tool also supports sending the packets as ERSPAN-wrapped packets. In this mode, the remote capture feature must be disabled and instead the regular live mode is used with an endpoint mode enabled interface.
This mode is used with the `-e` flag (which needs an ERSPAN session ID as a parameter). If this mode is used, the port doesn't need to be specified anymore.
sudo ./ap_capture_to_remote -e 123 1.2.3.4
In this mode, the endpopint mode for ERSPAN must be enabled and configured for the same IP as used in the ap_capture_to_remote command line argument.
Note that the IP address used is NOT the address or name of the management, but the separate IP address that is only valid on the interface for which the endpoint mode is configured.
