SIP module
The SIP statistics includes all SIP calls and their associated metadata.
SIP Statistics
Section titled “SIP Statistics”SIP Dashboard
Section titled “SIP Dashboard”The SIP dashboard tab provides an overview of the gathered SIP statistics.
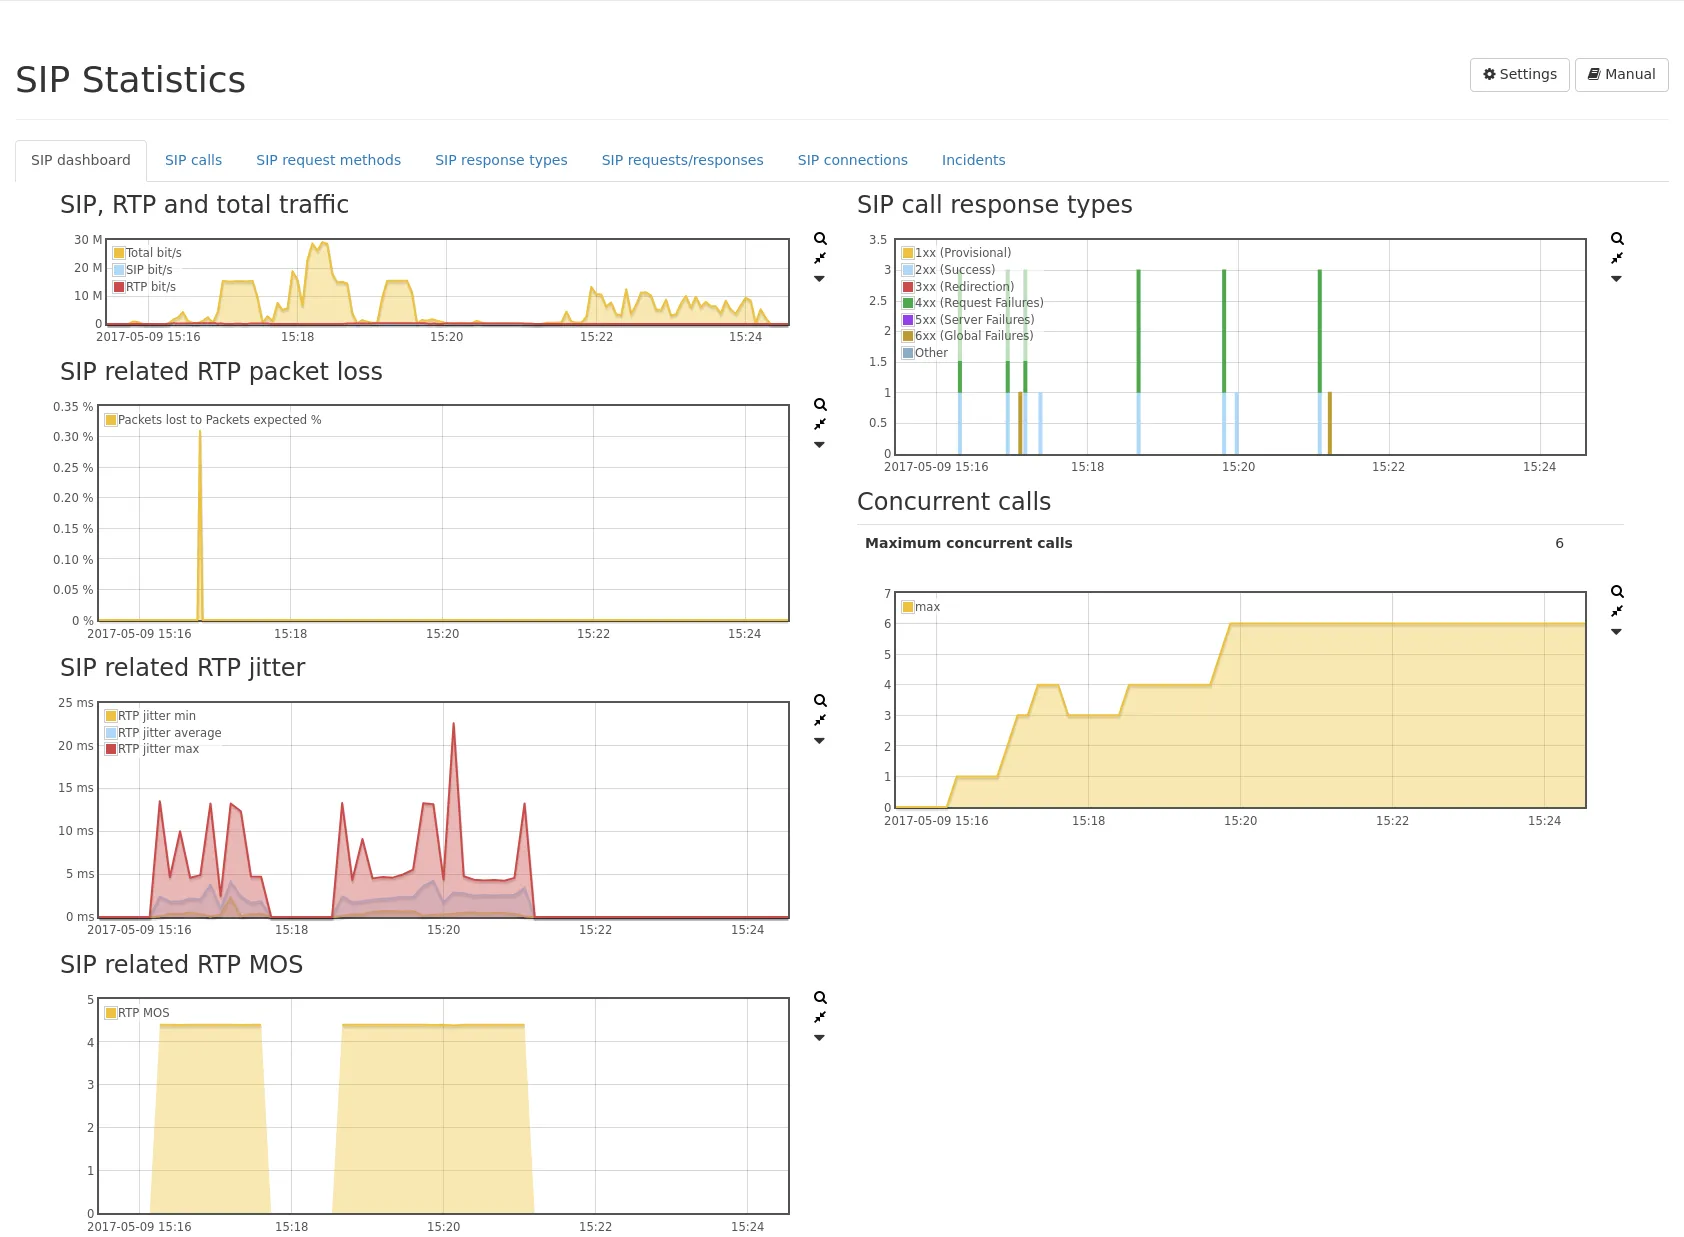
These include:
- SIP traffic, RTP traffic as well as total traffic.
- RTP packet loss (SIP related only as of firmware 4.3).
- RTP jitter (SIP related only as of firmware 4.3).
- RTP MOS (SIP related only as of firmware 4.3).
- Distribution of SIP response types.
- Number of concurrent calls.
On the right, there is a table and a graph showing the number of SIP call response types per response class. Additionally, there is a table and a graph showing the maximum number of concurrent calls.
Per-Call statistics
Section titled “Per-Call statistics”The SIP calls tab, contains a table listing all SIP calls in realtime or from the selected interval.
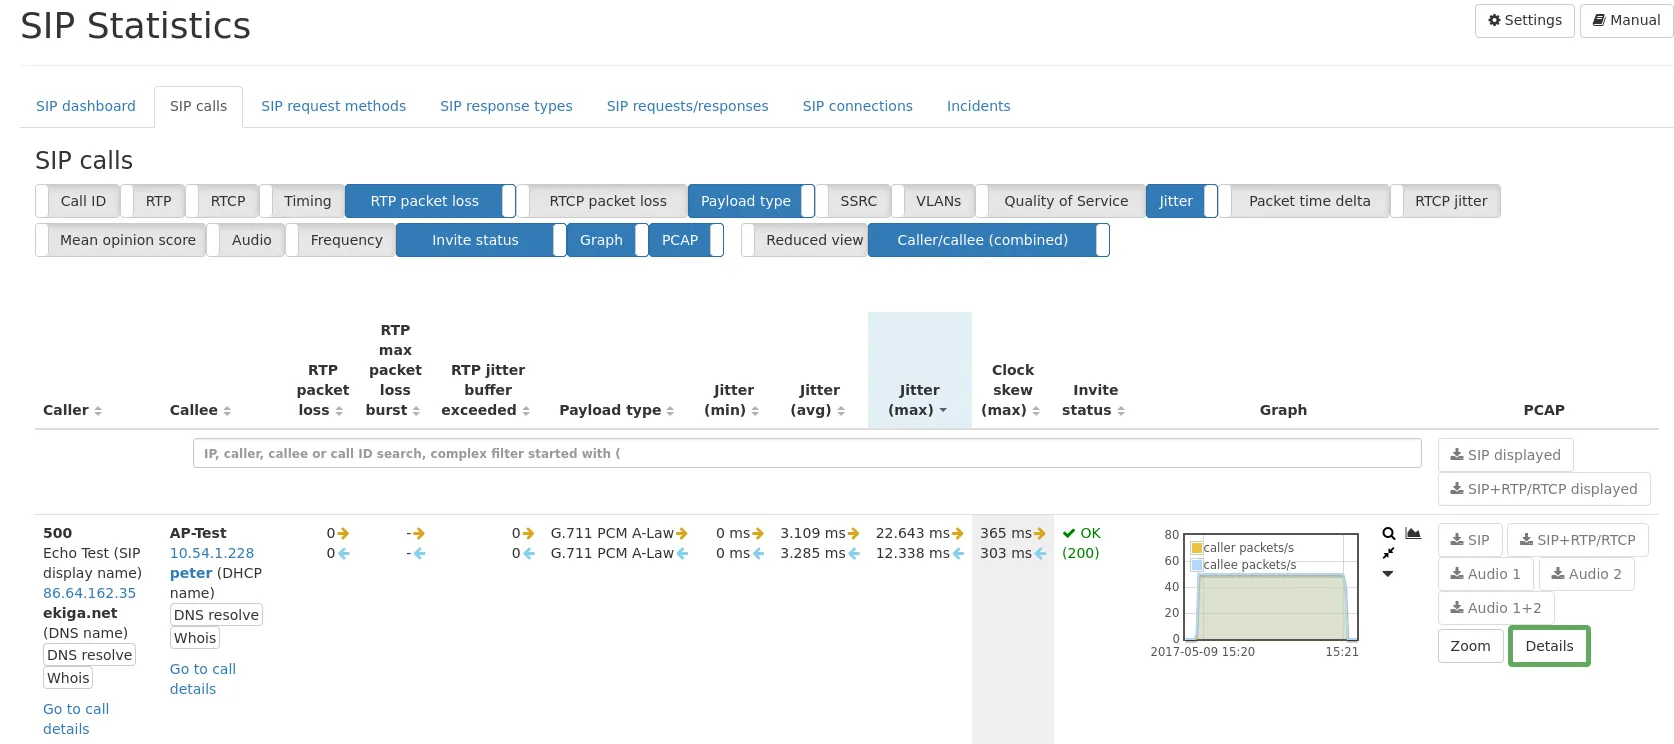
For each call, the call statistics and the related RTP statistics are shown. These include:
- The IP (see Common table columns - IP) for caller and the callee is shown, as well as the phone number/SIP address and all correlated naming information. By clicking on the Details button on the far right, a detailed summary page for the particular call will be displayed.
- The Call ID column lists the call ID and all similar identifiers (e.g. P-Palladion-ID or Av-Global-Session-ID) for the SIP flow. The small filter icon allows for setting a filter for any of these call identifiers. This allows for filtering all legs of one call, even if several SIP flows were involved.
- The SIP displayed and SIP+RTP displayed PCAP buttons next to the filter bar will capture all SIP calls visible on the table page. A filter that limits the visible SIP calls is taken into account. You can increase the elements of the table to have more calls captured.
- The RTP IP and port for caller and the callee are shown, if the call is/was successful and an RTP stream could be initiated.
- The RTCP IP and port for caller and the callee are shown, if RTCP packets were seen. RTCP packets contain information about quality parameters such as RTP packet loss and jitter. They are sent by the caller or callee and provide feedback of the RTP packets they have received.
- Call initiation, Call established, Call end time and Call duration are displayed.
- RTP packet loss per direction is shown.
- RTP payload type (codec) per direction is shown.
- RTCP reported packet loss is shown. The loss occurred in the indicated direction.
- QoS tags per direction of both the SIP and RTP flow are shown.
- Jitter of RTP stream per direction is calculated and shown.
- Jitter buffer exceeded: This is the amount of events of RTP jitter exceeding the configured jitter buffer threshold. The threshold can be configured in SIP module settings.
- Packet time delta of RTP stream per direction is calculated and shown. This is the time delta between two subsequent RTP packets. It is shown as min/avg/max value for the selected timespan or the duration of the whole connection.
- RTCP reported jitter is shown. The jitter was measured for the indicated direction.
- The maximum clock skew (negative or positive) is shown.
- Mean Opinion Score (MOS) per direction is evaluated and shown.
- R value per direction is evaluated and shown.
- Audio level (min, max and RMS) per direction is shown, if G.711 codec is used. The values are extracted from the samples of the RTP packets. The max value will show peaks, whereas the RMS will show an average loudness level and a better impression of the whole call. The values are displayed in dbFS.
- Expected and actual sample rate per direction are displayed and the measured bitrate of the RTP stream.
- Status of origin SIP invite request that initiated the call is shown.
- The graph (see Common table columns - Graph) shows information of the RTP stream per direction. Graphs for packet rate, dropped packets, overhead (duplicated) packets, Jitter, MOS and max audio level over time can be displayed using the graph selector.
It is also possible to capture traffic for a specific SIP call by clicking on the corresponding button in the last column. First click the Zoom button below the PCAP buttons, to select the time range of a call. The PCAP button SIP will only extract the SIP packets for that specific call by taking IP addresses and SIP call IDs into account. The PCAP button SIP+RTP/RTCP allows extracting both the SIP and RTP packets of that specific call.
The toggle button Caller/callee (combined) allows for switching the display to have both caller and callee counters in separate columns for easier sorting. The toggle button Reduced view allows switching the display to a condensed mode where one call only needs one row. With this mode it is possible to show up to 100 lines on one page.
For audible validation of call quality (e.g. distortion not caused by the network), it is possible to extract the audio of RTP streams as an MP3. Buttons allow to capture each direction (A/B) and also both directions of the audio stream mixed into one stereo file (each direction will be a different channel). The MP3 extraction is only supported for the following codecs:
- G.711 A-law (ALAW)
- G.711 μ-law (ULAW)
- G.722
- G.729
- Opus (*)
- AMR and AMR-WB (*)
- EVS (*)
- GSM
(*) These codecs are negotiated in the SIP SDP handshake and can only be extracted if the handshake was seen by the Allegro Network Multimeter.
On the bottom of the table the CSV download button allows exporting all pages of the table in CSV format.
Mean Opinion Score
Section titled “Mean Opinion Score”The displayed Mean opinion score (MOS) of a call is calculated from various metrics within an RTP stream. Following scores are used:
- 1: bad
- 2: poor
- 3: fair
- 4: good
- 5: excellent
The Mean opinion score is only calculated for the following codecs:
- G.711 A-law (ALAW)
- G.711 μ-law (ULAW)
- G.722
- G.729
- GSM
Call details page
Section titled “Call details page”By clicking on the Details button, next to a call on the far right, a very detailed call statistics page will be opened.
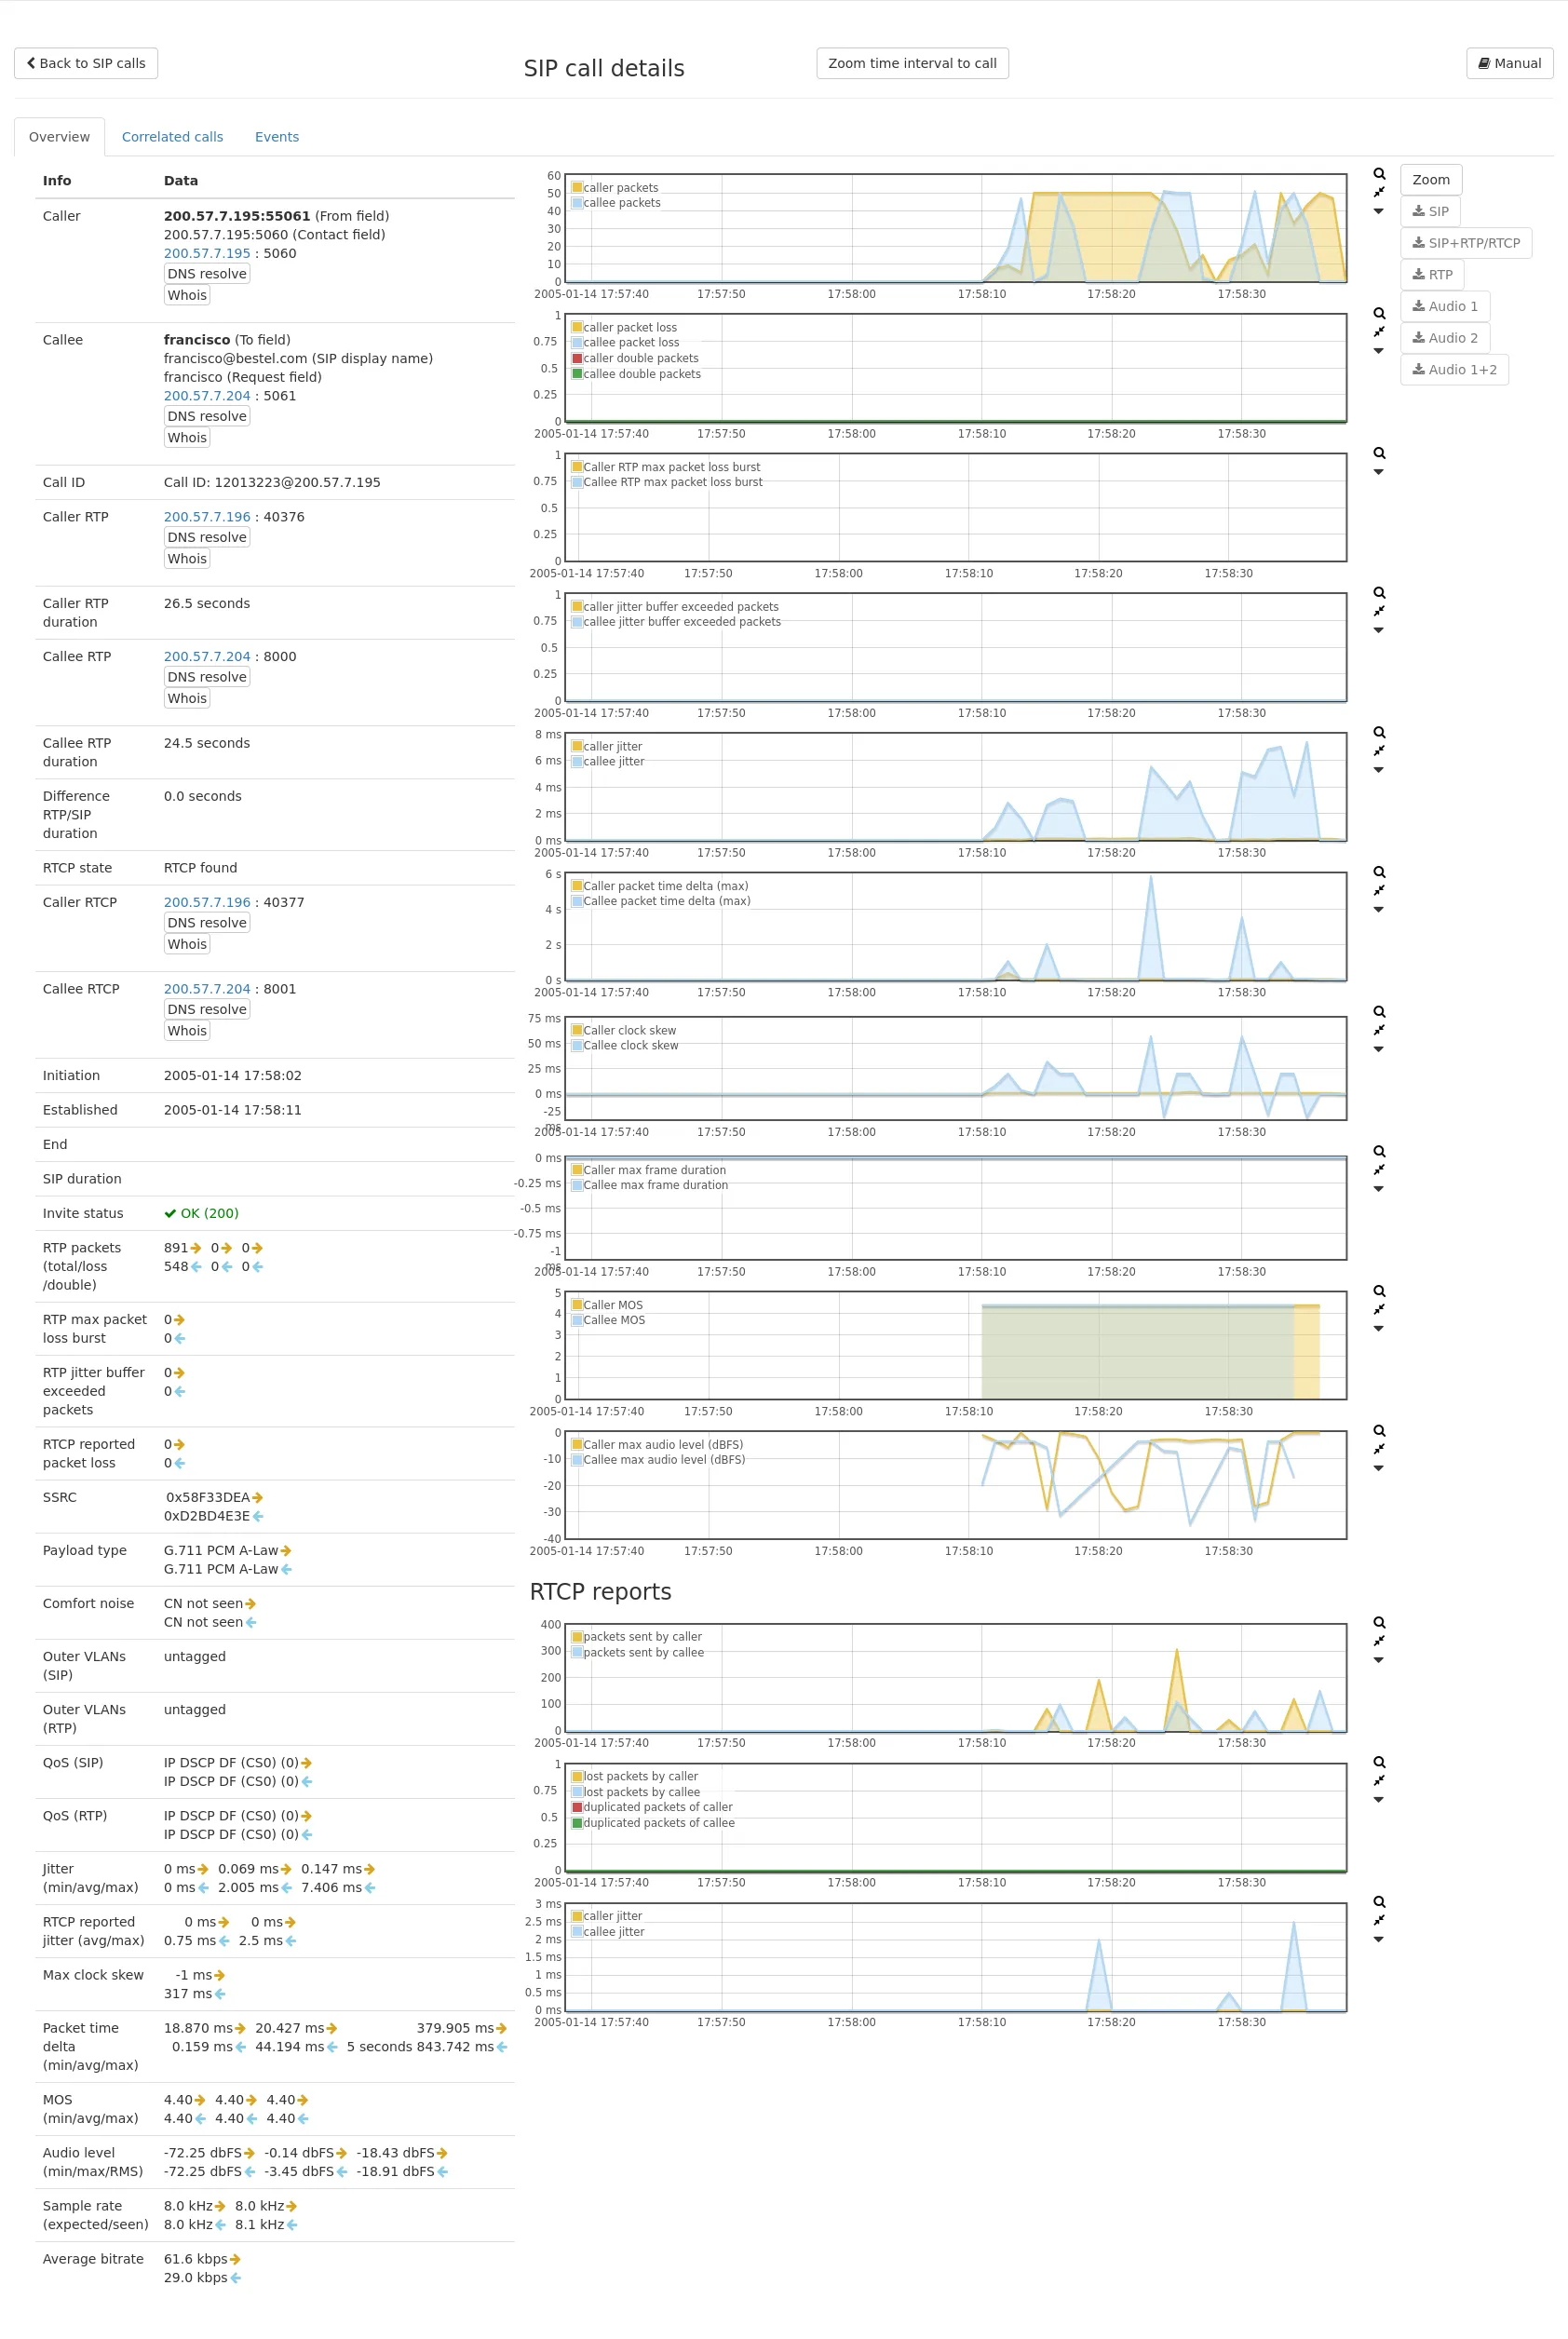
On this page all information of the global call list are shown in a very detailed overview summary. Here you’ll also find a tab Correlated calls that lists all calls with the same SIP call ID. The Events tab shows all SIP packets per direction for that SIP flow with the given SIP call ID.
If an RTP connection was found for that SIP call, RTP statistics are shown as well with additional information for the actual voice/video connection.
SIP bindings
Section titled “SIP bindings”The SIP bindings tab lists the bindings between clients and registrars based on the SIP REGISTER messages seen by the Multimeter. Each Binding is defined by the unique combination of client, registrar and call ID. The table includes fields which are updated by the most recent REGISTER message (e.g. Last registered Contact, Last requested expiry, etc).
SIP request methods
Section titled “SIP request methods”The SIP request methods tab lists the observed SIP requests. A table lists the number of events and a graph showing the event distribution.
For each request method there is a detail view showing the IP addresses seen sending the specific request.
SIP response types
Section titled “SIP response types”The SIP response types tab lists the SIP status codes of observed SIP responses. A table lists the number of events and a graph showing the event distribution.
The response types are grouped into the following classes:
- 1xx - Provisional: Temporary status information. The server expects to take more time to obtain a definitive response.
- 2xx - Successful: The request was successful.
- 3xx - Redirection: Inform about a new contact address or other services to establish a connection.
- 4xx - Request Failure: The request is invalid and could not be processed.
- 5xx - Server Failure: An involved server could not process the request.
- 6xx - Global Failure: The request cannot be processed, even not with alternative destinations.
For each response type there is a detail view showing the IP addresses seen sending the specific request.
SIP request/response pairs
Section titled “SIP request/response pairs”The SIP requests/responses tab lists the observed SIP request/response pairs.
A table lists the number of events and a graph showing the event distribution.
The events are accounted at the time of the response. If there are multiple requests (retransmissions), but only a single response, this will be accounted as one request/response pair.
For each request/response pair there is a detail view showing the involved IP addresses.
SIP connections
Section titled “SIP connections”This table lists all SIP connections, separated by IP addresses. By clicking on the events magnifier icon, the SIP connection events page will be shown with all SIP packets for that connection.
SIP connection events
Section titled “SIP connection events”The events page shows all SIP packets between two specific IP addresses. The table can be filtered by SIP call IDs and allows displaying SIP packets of a specific call.
SIP module options
Section titled “SIP module options”The following settings are available for the SIP module:
-
Store individual SIP events: This option enables the storage of individual SIP events for each SIP connection. If enabled, the event list of each connection will list all SIP messages separately (such as OPTION, INVITE, etc). This allows to see the SIP packet flow between the client and server. This however uses more memory so it can be disabled if it is not needed.
-
Enable measurement of RTP jitter and packet loss: This option enables the calculation of jitter values and packet loss, which are accounted globally and per interface, and per IP address and connection (if enabled in the IP module). Disabling this option improves the system performance and reduces the memory utilization.
-
Ignore samples below this threshold for audio RMS calculation (negative dbFS, 0 = inactive): Audio RMS calculation by default is done for every sample. With this setting, silence or background noise of e.g. < -80 dbFS can be ignored and don’t have an impact on the RMS.
-
Generate RTP statistics per network interface: When enabled, the RTP statistics are also stored per network interface. Depending on the number of interfaces and the amount of RTP traffic, this can have an impact on the system performance and the option can therefore be disabled if such information is not needed.
-
Calculate audio level for supported codecs: When enabled, the audio levels are calculated for all supported audio codecs. This option has a large impact on the performance so it can be disabled if such analysis is not needed.