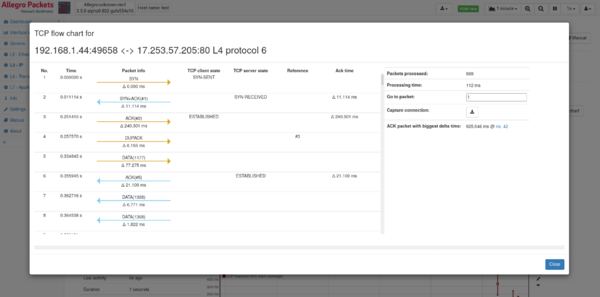
TCP flow chart
The TCP flow chart feature allows for a detailed view of a TCP connection by using a retrospective analysis. It will extract all packets for a selected connection from the ring buffer or packet buffer and runs a detailed analysis on these packets.
Table packet view
The results are shown in a table on the left hand side containing all packets, their time (which can be toggled between relative and absolute time by clicking on it) and detailed packet information. This information contains the direction of the packet and the packet type, like actual data, SYN, ACKs, DUP-ACKS, retransmission, etc. For ACK packets, the ack'ed packet number is shown and can be clicked to jump to that packet. Below the direction arrow the delta time to the previous packet is shown.
A simplified TCP state is shown for both client and server side.
Some packets, like DUP-ACKs or retransmissions, also describe a reference packet to which they refer to. The number of the reference packet is shown in the "Reference" column, clicking on it navigates to that packet.
The "Ack time" column shows the time between ACK packets and the previous data packet this is being acknowledged.
The packets in the table can be clicked to highlight the time in the graphs on the right hand side.
Buttons on top of the table allow to navigate to the next or previous occurrence of specific unusual TCP events, such as retransmissions, missed data, or duplicate ACKs.
Summarized statistics
The right hand side of the window contains some summarized values about the analysis.
A text field can be used to enter any packet number to jump to that packet in the table view.
The connection can be captured by using the corresponding button.
The maximum time between data and its acknowledgement is shown. Large values indicate network problems when packets may not have been received.
The time can be restricted by selecting an interval in the graphs below. The selected time period is independent of the global time period. A button on the right hand side part of the view allows to reset the time window back to the whole connection duration, and the second button allows to apply the time period to the global time. This allows to further analyze other network traffic in some selected time period.
Traffic graphs
Detailed graphs are available for different traffic metrics. The graph can be clicked to jump to the corresponding packet in the packet table, and packets can be clicked to highlight the graph section with a vertical line.
In contrast to other graphs in the regular live analysis, these graphs are always in millisecond resolution for the whole duration of the connection, so no data reduction is used for older data.
- Traffic: these graphs show the throughput in bit/s and packets/s for the connection.
- TCP zero window packets: this graph shows zero window packets that occurred within the connection.
- TCP window usage: The amount of data inside the respective windows in percent.
- DUP acks: this graph contains all occurrences of duplicate acknowledgments.
- TCP retransmissions: this graph shows all retransmitted data.
- Client and server sequence/acknowledgment: These graphs show each individual TCP sequence number and acknowledgment number. This makes it easier to spot large delays in receive acknowledgments, which often happens during time periods with retransmissions.
- Missing data: This graph shows data of TCP segments that have not been seen by the Allegro Network Multimeter. Main reasons for such data are errors in capturing (overloaded capturing), or overloaded or misconfigured mirror ports.
Limitations
- Since the analysis takes significant memory per connection, the analysis is not performed on live traffic. Instead, a ring buffer (or packet buffer for pcap analysis) is required to be able to extract the connection and run the analysis on that data. The analysis only uses the TCP header information, so it is sufficient to have the ring buffer configured to store truncated packets containing only the L4 header.
- The analysis result is stored on internal storage instead of main memory to keep as much memory available for live processing. Therefore, there is a size limit on how large the connection can be. The maximum number of packets is 100,000, but it can be lower if not enough disk space is available.
- Due to disk space limitations, the number of parallel opened analysis windows is limited to 5. Starting another TCP flow chart will invalidate the oldest one automatically.
- The analysis of a TCP connection starts at the beginning of the connection and stops either at the end of connection or the end time configured in BIT-Mode. Since the packets are extracted from ring buffer, the analysis may take some time (especially if it is a long-lasting connection). A progress bar informs about the status of the analysis.


