VoIP monitoring and troubleshooting
Nowadays, in most companies phone systems are based on Voice over IP (VoIP). While VoIP has quite some benefits over legacy telephone infrastructures, VoIP also introduces new challenges for network administrators and engineers who are responsible for upholding a great network. More often than not, VoIP services and traffic are passing through the very same infrastructure components that also handle your regular server/end-point communication. Thankfully VoIP is a rather low-bandwidth type of communication (E.g. codec G.711 uses 64 Kbps Bit rate, resulting in 87.2 Kbps Nominal Ethernet Bandwidth (one direction)). On the other hand however, Administrators better be on their A-game concerning the overall quality of their network, because VoIP relies on impeccable timings and a minimum amount of packet loss.
The Allegro Network Multimeter helps network administrators and engineers by providing full visibility into VoIP communications, paired with advanced VoIP troubleshooting capabilities.
VoIP monitoring and analysis with Allegro Network Multimeters can be done in real-time and back in time.
Global SIP statistics
Section titled “Global SIP statistics”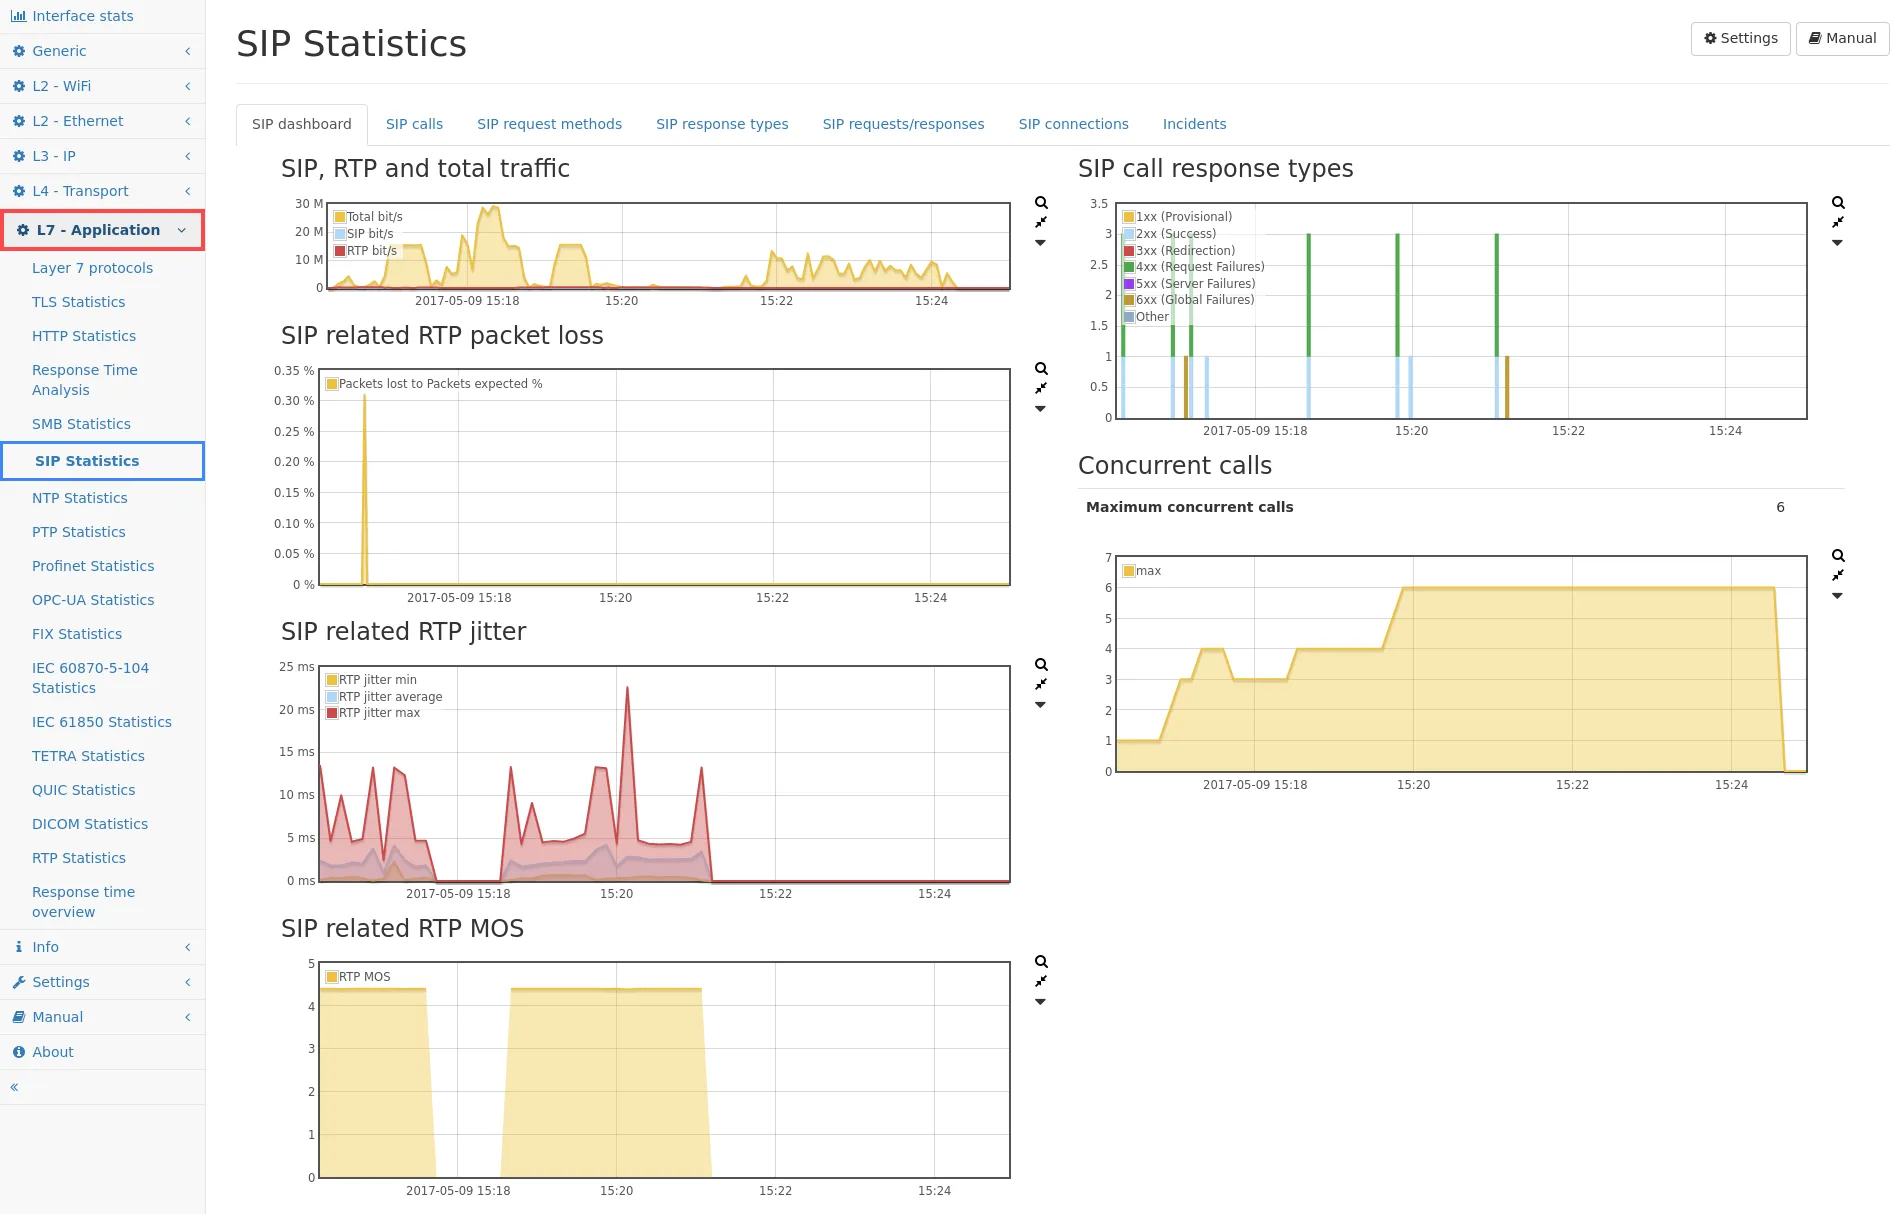
VoIP analysis and debugging in the Allegro Network Multimeter can be reached via the left menu L7 – Application → SIP Statistics. The overall SIP statistics dashboard, as shown in the picture above, will be presented to the user. This screen is intended for “taking a step back” and enables the administrator to look at statistics and incidents over time. Were there instances of abnormal packet loss or high jitter over the past 4 days, might be a good example. The graphs are rather self-explanatory and depict traffic distribution stats, packet loss and jitter information, a concurrent call trend graph and statistics revolving SIP signaling response types/codes. Sections of all graphs can be selected with the mouse, to zoom into certain timeframes or incidents of interest.
VoIP calls analysis screen
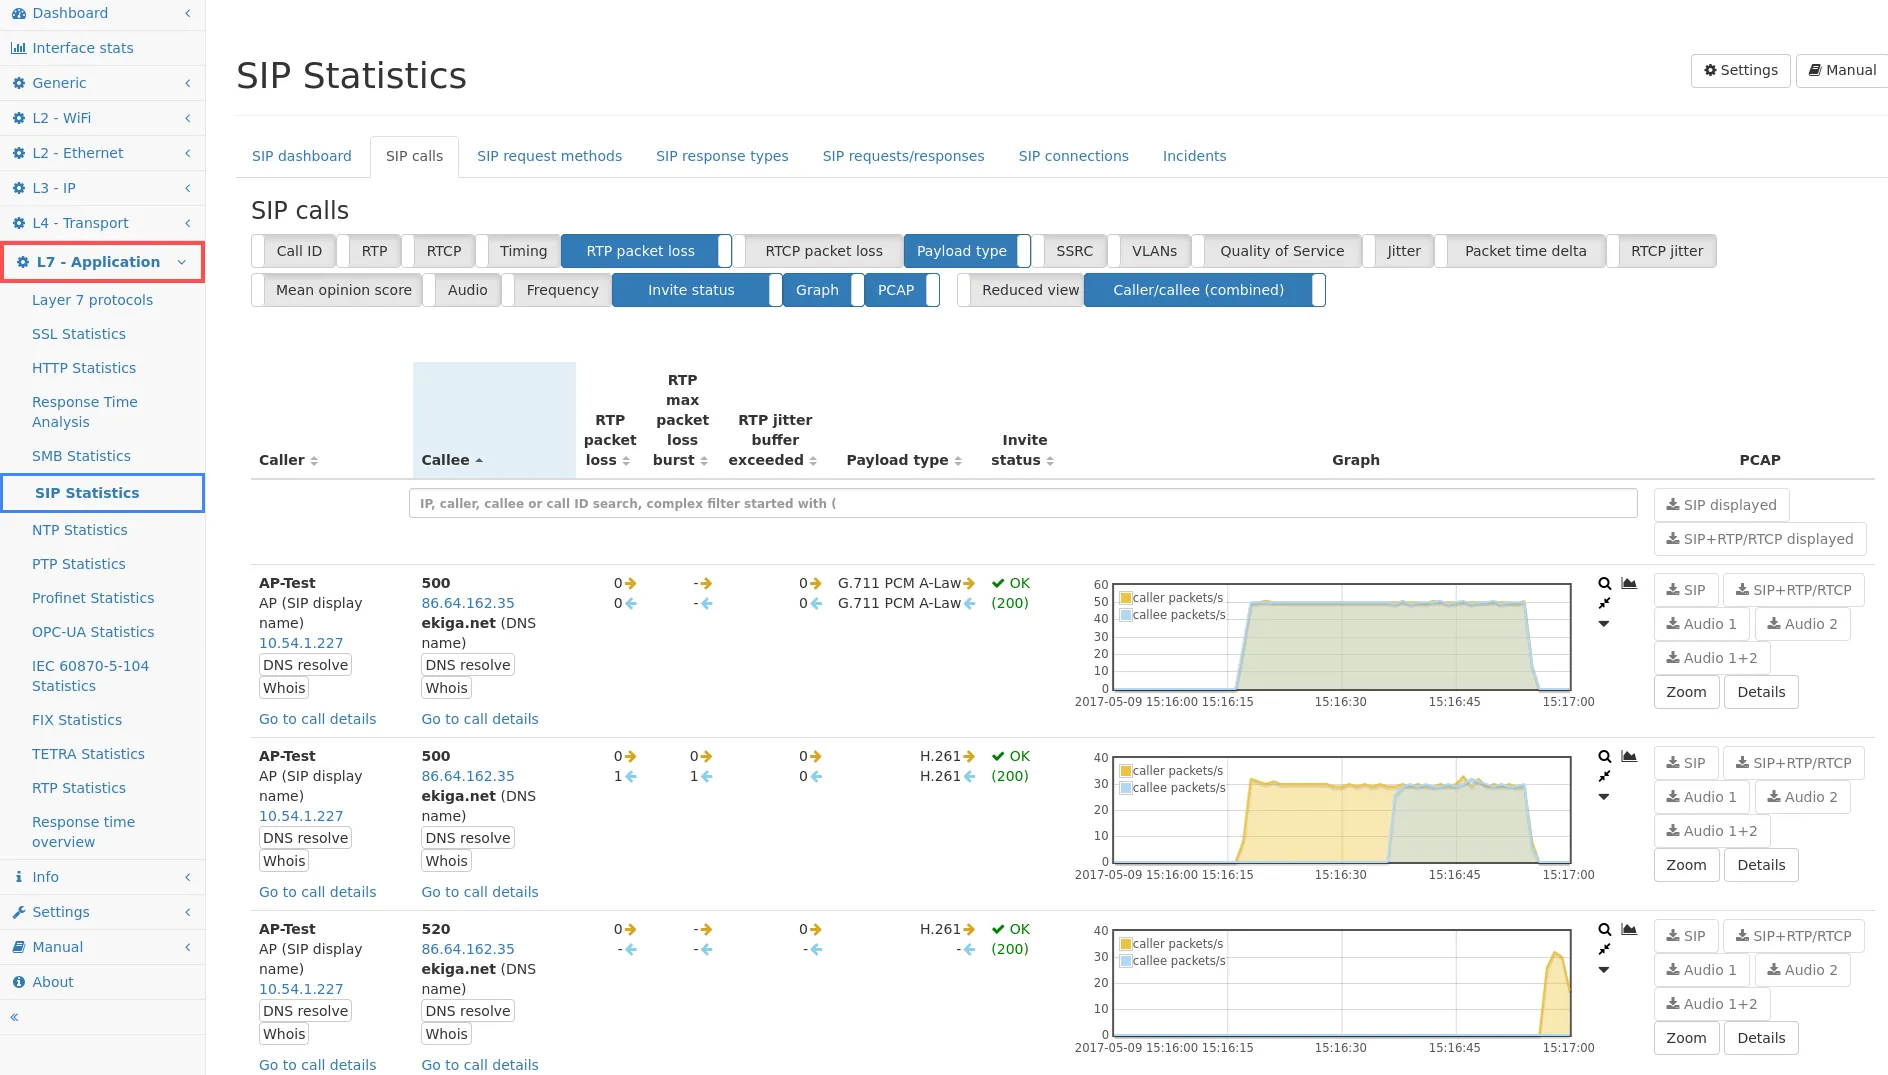
Section titled “VoIP calls analysis screen”Going into SIP calls tab, the user will be presented with a list of all the VoIP calls during a selected timeframe and/or in real-time. Multiple columns with statistics information can be toggled to be shown or hidden at the users discretion and tables can be sorted.
To investigate a specific phone number, e.g. from a person reporting
call (quality) issues, simply type in the phone number in the search bar
and sort your table of interest (e.g. Initiation time) accordingly.
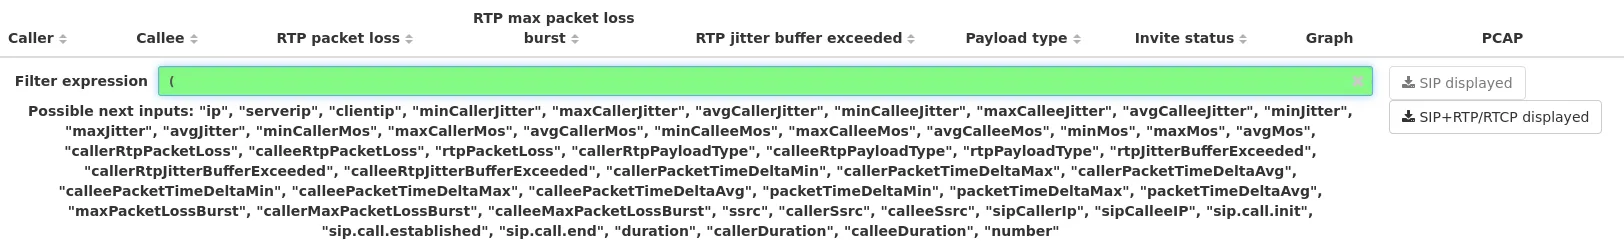
Throughout the Allegro Network Multimeter, the search bar can also be
used for applying complex display filters. If for example, from 100’s or
1000’s of indexed VoIP calls, you are only interested in the
unsuccessful ones ((statusCode != 200) would apply). We’ve already touched
on VoIP’s sensitivity to timings. One may state that, jitter above 20ms
in either call direction, starts to impact and degrade call quality. The
higher the jitter the more call quality will suffer. For a list showing
only calls that were affected by bad jitter, filter (avgJitter > 20) is
easily set within the search bar on the SIP calls screen.
Detail report for an individual call
Section titled “Detail report for an individual call”Next to each and every specific call, you will find a couple of buttons to make your life so much easier. Please note that the column toggle PCAP must be enabled. Right now we will go into the Details button as highlighted below.
Administrators and engineers often find themselves in a position where they are interested in the history of events or a detailed report. A one pager that tells the whole story and features a couple of graphs to more easily translate to the less tech savvy people who might be involved. Clicking on the Details buttons next to a call will give you just that.
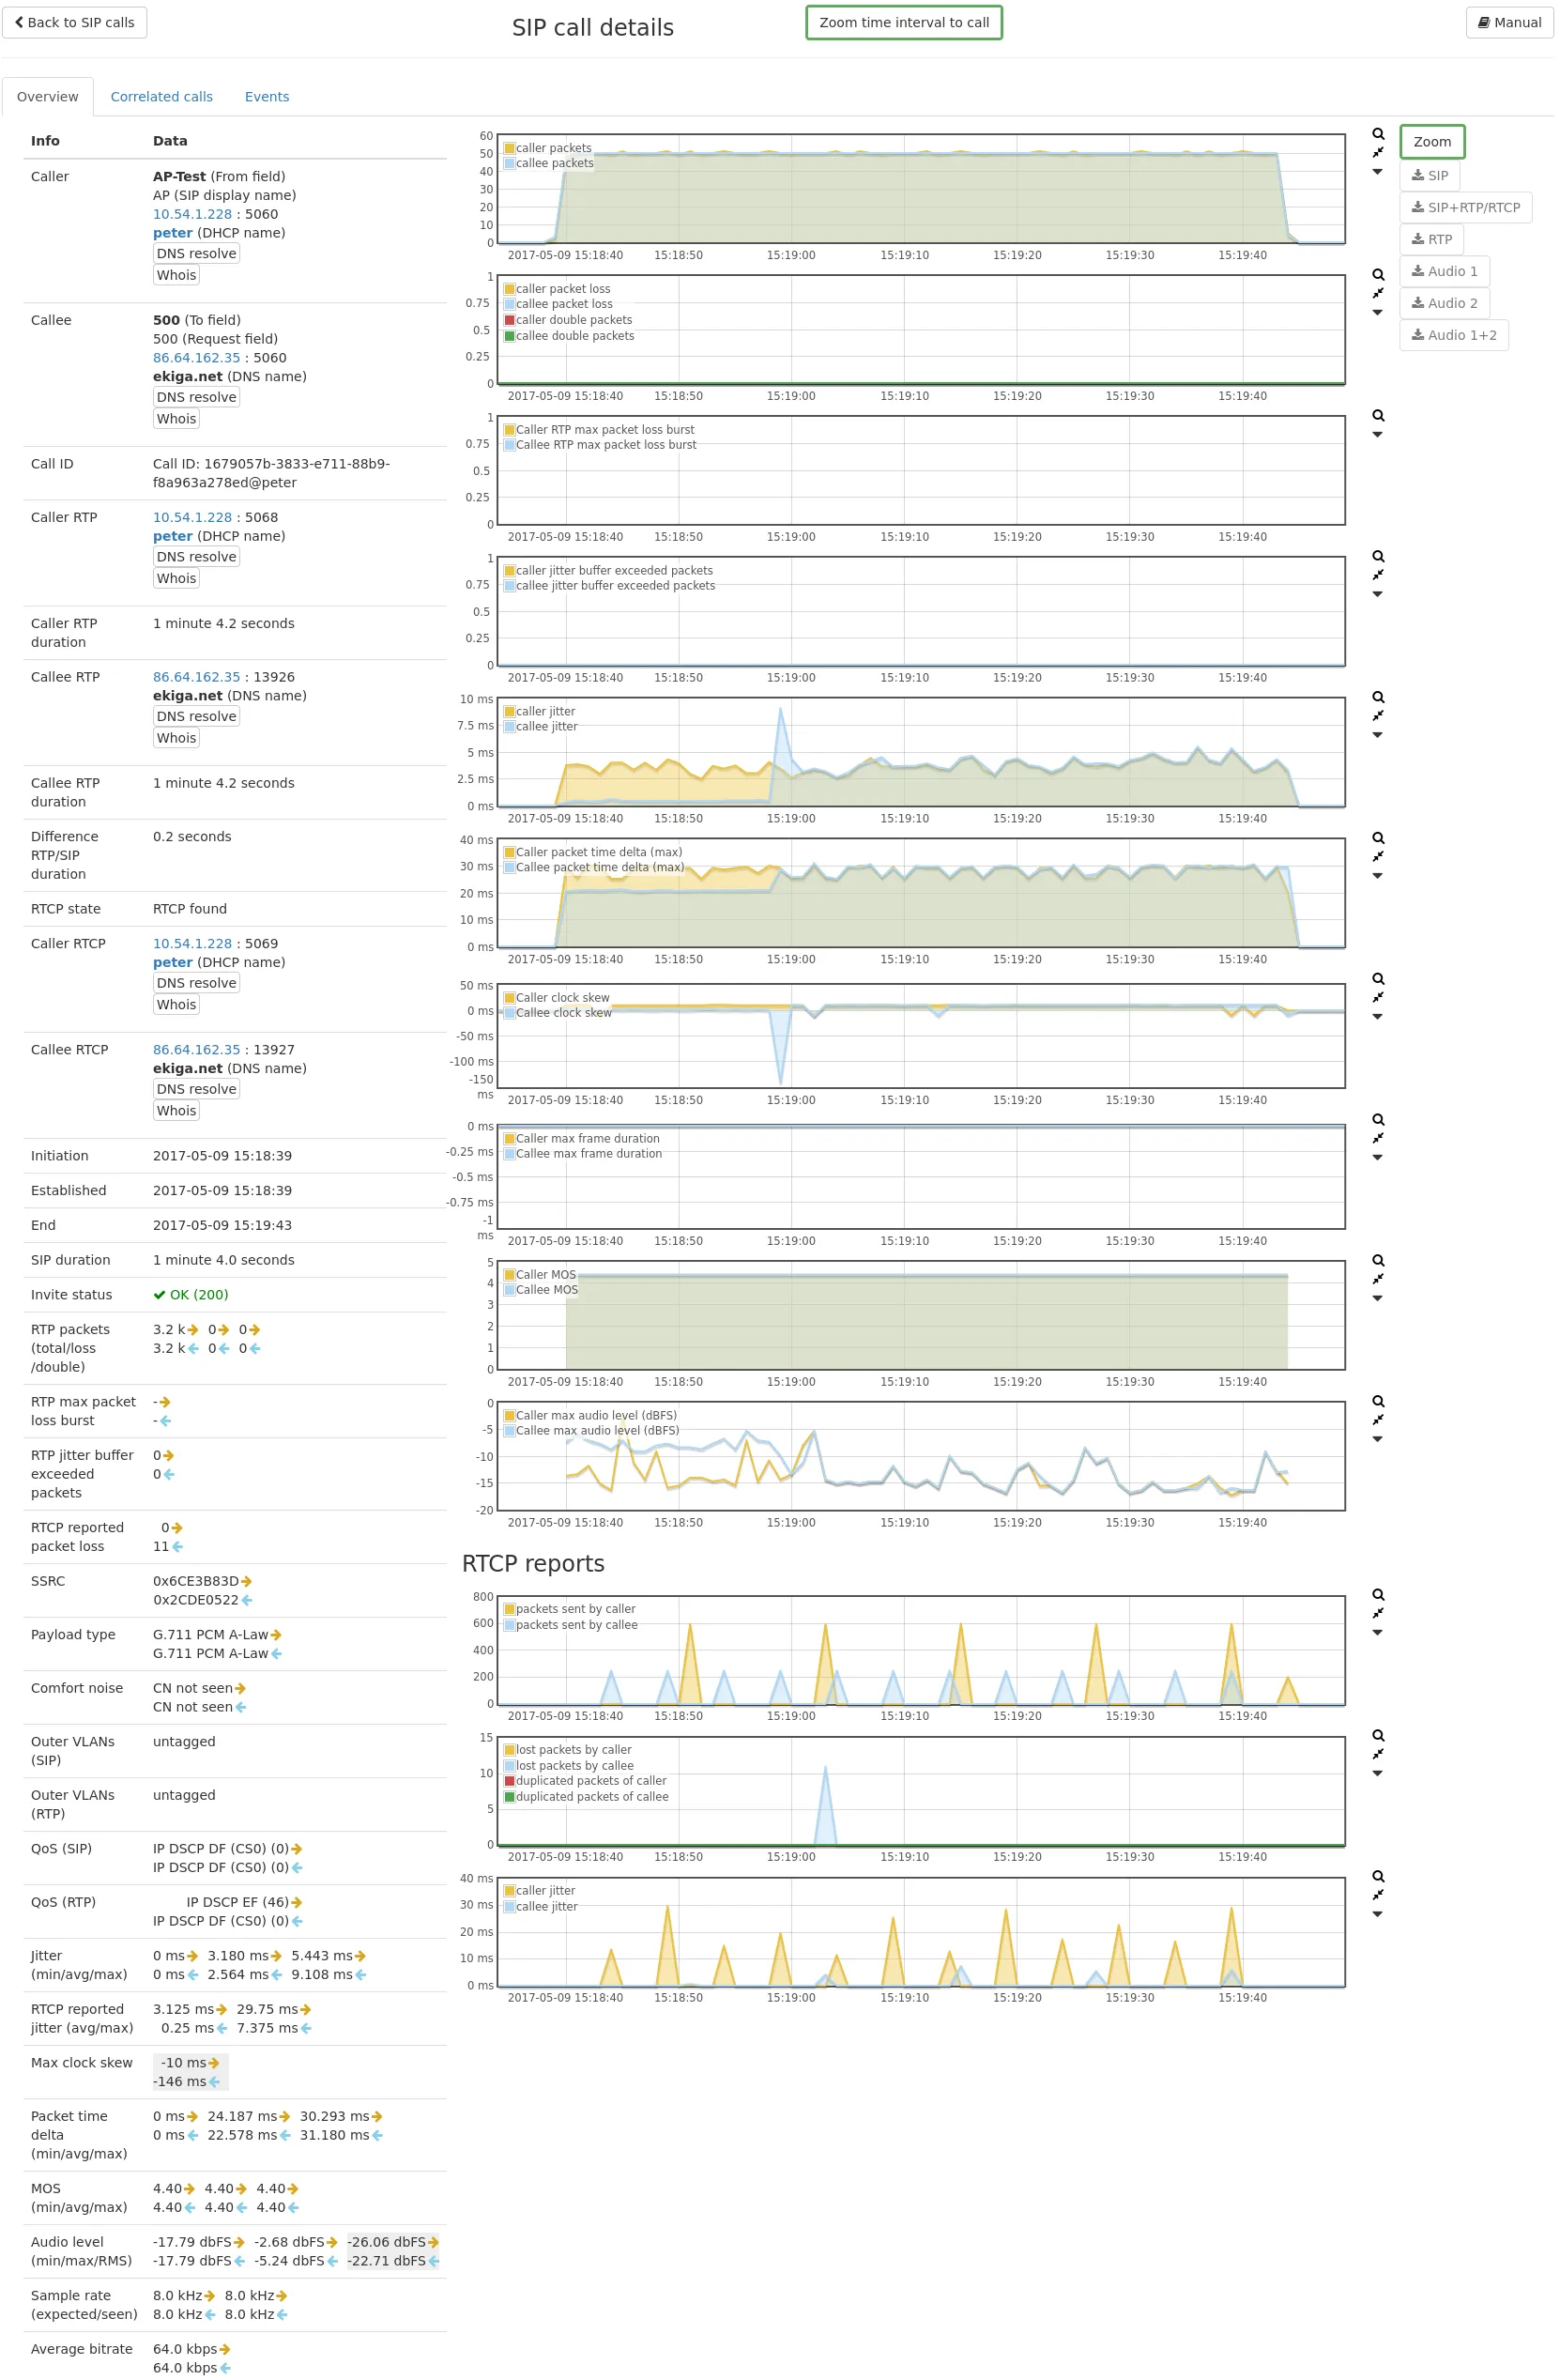
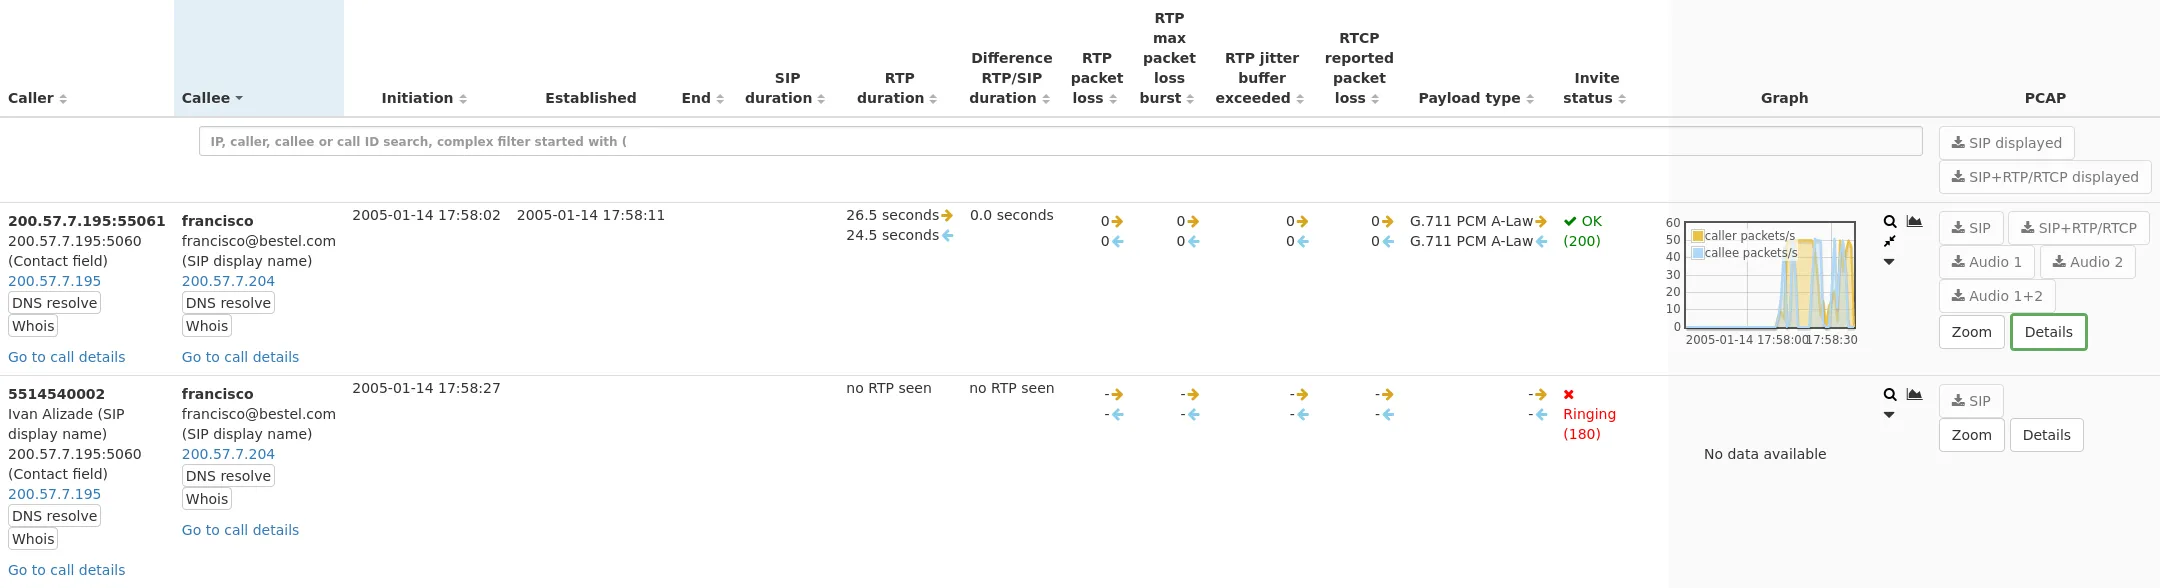
When the call details page is opened, it is important to first click on one of the Zoom to call buttons. When doing so, the data shown in the Allegro Network Multimeter will be focused (or zoomed in) on the exact time and duration in which the call started and ended. You will now see the data and statistics revolving the call nicely centered in their respective graphs. Condensed into one view, you’ll find your facts and figures about the codecs and the network on the left hand side of the screen, trending graphs of key quality metrics in the middle and capture buttons on the right of the screen.
Packets, jitter and MOS
Section titled “Packets, jitter and MOS”In the top graph you can see the packet stream (or data stream) for the specific call. The second graph holds all the information revolving packet loss and overhead packets. The third graph displays the critical information: jitter. Fact is, that the performance and quality of a network and its services, is dependent on multiple factors. The VoIP specific scoring algorithm called MOS, calculates a call quality grade from 1 (bad) to 5 (best), based on multiple criterias such as the Codec, its sensitivity to packet loss and the actual packet loss in the network.
In every graph dips or inconsistencies will be clear to see. The measurements shown are available and displayed per individual A/B number i.e. the caller and the callee.
Audio Level Graph (dBFS)
Section titled “Audio Level Graph (dBFS)”The fifth graph from the top shows audio Level information about the RTP audio coming from both directions. This is helpful when an end-user complains about bad quality during a phone call. Often times, the complaints are not more detailed than this. As an administrator you might already be considering voice distortion, interrupts or crackling noise. Now, voice distortion, delays and interrupts may very well be caused by packet loss and/or bad jitter. So navigating to the call detail screen to investigate how bad the packet loss and jitter were at the time of the call, you instantly see: no packet loss, perfectly low jitter! It’s not the network. In such cases you can easily take a glance at the audio Level graph for visual confirmation of audio clipping (the level where distortion sets in) whenever the graph goes above 0.

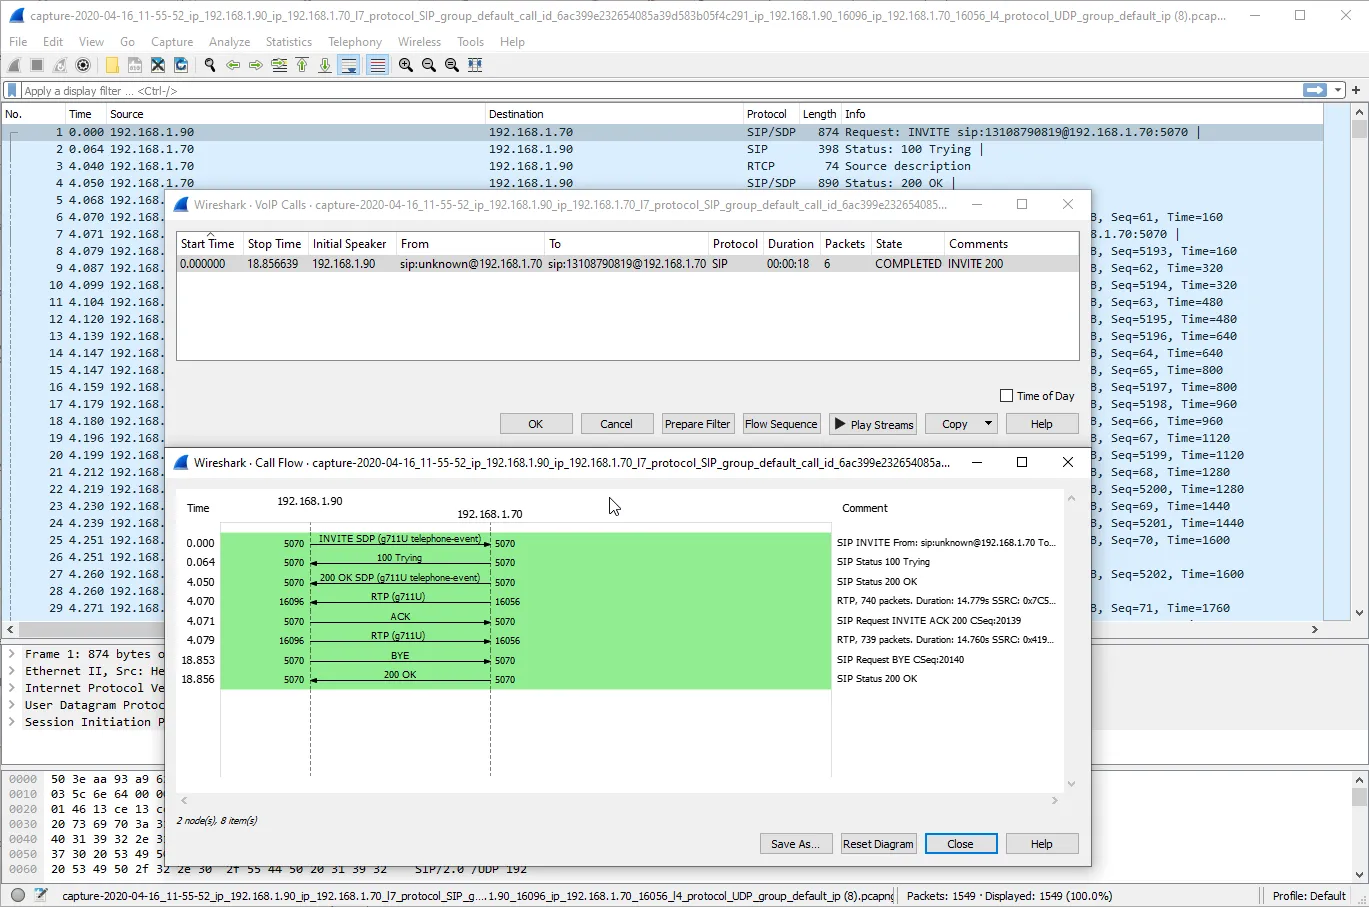
RTCP reports
Section titled “RTCP reports”Notice that the Allegro Network Multimeter also decodes the RTCP reports that are sent between handsets. This provides additional valuable insights regarding packet loss and estimated jitter, as experienced by a caller/callee handset (outside of your network) itself.
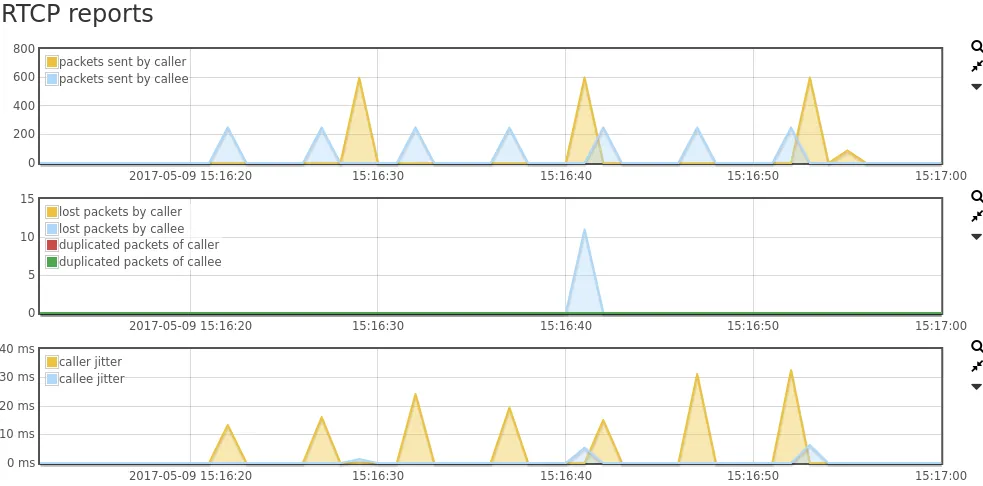
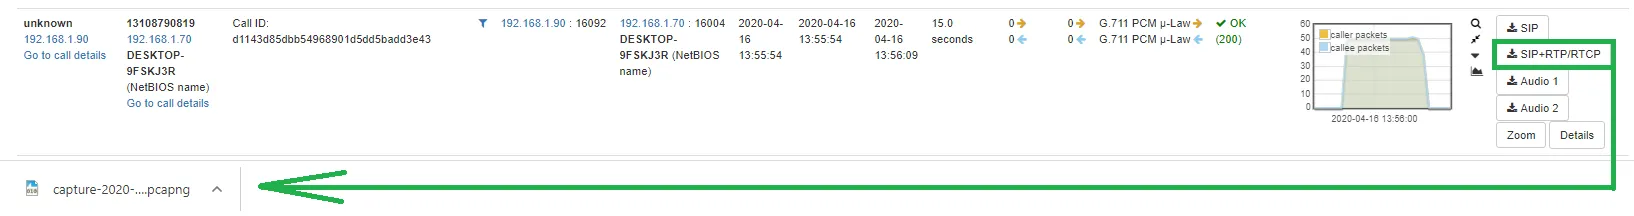
Getting a PCAP from SIP, RTP, RTCP
Section titled “Getting a PCAP from SIP, RTP, RTCP”We’ve learned from network administrators and engineers that it is not an easy task to capture and view the SIP and its corresponding RTP of a call in Wireshark. Especially on links where multiple calls were active. This is however very easy with an Allegro Network Multimeter. Next to each individual call on the SIP calls screen (and on the SIP call details page), you will find several download buttons. Herewith the corresponding and correlated data can easily be extracted and downloaded as a PCAP. Whether you are interested in viewing just the SIP flow in Wireshark, or retrieve a calls’ correlated SIP+RTP+RTCP all in one cleanly filtered PCAP for post analysis. It’s all just 1 click away in the Allegro Network Multimeter. The slicing of recorded packet data is supported and fully customizable within the Allegro Network Multimeters. For instance, one may want to slice RTP packets after the first 80 bytes to eliminate the possibility for listening in on conversations.
Audible VoIP troubleshooting (MP3)
Section titled “Audible VoIP troubleshooting (MP3)”Crackling, echoing or muffled audio may very well not be due to the network. Unfortunately these specific things also cannot be derived from the information in the audio Level graph. It’s cases like this for which the Allegro Network Multimeter provides download buttons for retrieving calls as an MP3. As such, where allowed or where troubleshooting benefits outweigh privacy constraints, the administrator/engineer is enabled to download calls in form of an MP3, for audible troubleshooting. This greatly helps troubleshoot very specific issues, and provides audible evidence of bad headsets (cable), terrible car kit or other things alike. This feature may be disabled for certain users by means of user-roles. Also, the slicing of recorded packet data is supported by the Allegro Network Multimeter to a great extent. Therewith and per example, one is able to slice RTP packets after the first 80 bytes, to prevent the reconstruction and replay of audio.