Investigate Network Load: Difference between revisions
(Undo revision 5061 by Markus.Geissler (talk)) Tag: Undo |
No edit summary |
||
| Line 3: | Line 3: | ||
the load on a network? Let's take a practical example: multiple users | the load on a network? Let's take a practical example: multiple users | ||
complain that their network connection is sometimes very slow. | complain that their network connection is sometimes very slow. | ||
For example; an event between | For example; an event between 11am and 12pm. | ||
== Dashboard == | == Dashboard == | ||
| Line 9: | Line 9: | ||
Open the web interface via a browser. | Open the web interface via a browser. | ||
[[File: | [[File:Investigate_network_load_dash.png|1000px|Allegro Network Multimeter Dashboard]] | ||
== Time Selection == | == Time Selection == | ||
| Line 16: | Line 16: | ||
{| | {| | ||
| [[File: | | [[File:Investigate_network_load_time_select.png|300px|thumb|right]] | ||
|} | |} | ||
In this case, we are looking for events from this morning | In this case, we are looking for events from this morning. Now select the time period in which the users have reported | ||
problems by selecting (click 'n drag) such section with the mouse: | problems by selecting (click 'n drag) such section with the mouse: | ||
{| | {| | ||
| [[File: | | [[File:Investigate_network_load_time_drag.png|600px|thumb|right]] | ||
|} | |} | ||
| Line 31: | Line 30: | ||
are easy to clarify on the Dashboard: | are easy to clarify on the Dashboard: | ||
* | * '''TOP protocols:''' Endpoints in a network can experience increased and unexpected traffic such as large Windows updates. By clicking on the protocol you can see which IPs generated this traffic. | ||
* | * '''TOP IP addresses:''' For example, there may be several backups running at the same time which burden the link and internal servers. | ||
* | * '''TOP MAC addresses:''' If, for example, significant multicast or broadcast traffic appears here; this can indicate loops or similar issues, and a packet storm can place a heavy burden on a network. | ||
* Is there | * Is there '''extremely low or no network traffic''' during this period? This may indicate link problems such as no connection to the Internet or to another network node. | ||
In our example, | {| | ||
By clicking on | | [[File:Investigate_network_load_top_statistics.png|1000px|thumb|right]] | ||
traffic: | |} | ||
Let’s check by clicking on ‘Top protocols during selected interval’ for the cause of the slow connection.<br> | |||
In our example, the ‘SSL’ protocol showed up with a large amount of packets transferred in the selected timeframe. | |||
{| | |||
| [[File:Investigate_network_load_top_protocol.png|1000px|thumb|right]] | |||
|} | |||
By clicking on ‘SSL’ under ‘Protocol’ you can easily see an overview of who triggered this traffic: | |||
{| | {| | ||
| [[File: | | [[File:Investigate_network_load_protocol_statistics.png|1000px|thumb|right]] | ||
|} | |} | ||
Here, | Here, in our example, on machine did a large download of 6 GB, which can lead to user disruption. | ||
By clicking on an IP address or clicking on ‘Connection details’ under ‘Go to’, you can further investigate the causes and even look into the IP’s connections: | |||
{| | |||
| [[File:Investigate_network_load_ip_statistics.png|1000px|thumb|right]] | |||
|} | |||
Under the ‘Connections’ tab you will find all connections the selected IP has made in the selected timeframe and you can even see the amount of TCP retransmissions that have been made<br> | |||
(to see the TCP retransmissions you might have to enable this option in your filter). | |||
{| | {| | ||
| | | [[File:Investigate_network_load_connections.png|1000px|thumb|right]] | ||
[[File: | |||
|} | |} | ||
You can use the number of retransmission to estimate if there was a bottleneck | You can use the number of retransmission to estimate if there was a bottleneck between the sender and the receiver and if more packets had to be retransmitted. <br> | ||
between the | Is there a high TCP retransmission? This could indicate an overload of the network segment or an WiFi device.<br> | ||
If you need a even more detailed analysis, you can use the pcap button to extract the connection packets.<br> | |||
{| | |||
| [[File:Investigate_network_load_download.png|1000px|thumb|right]] | |||
|} | |||
Latest revision as of 09:11, 23 May 2025
Challenge
How can you use the Allegro Network Multimeter to quickly and easily examine the load on a network? Let's take a practical example: multiple users complain that their network connection is sometimes very slow. For example; an event between 11am and 12pm.
Dashboard
First we start with an overview in the Dashboard. Open the web interface via a browser.
Time Selection
Next select a time view in the upper right corner, which is a longer timeframe than the interval to be examined:
In this case, we are looking for events from this morning. Now select the time period in which the users have reported problems by selecting (click 'n drag) such section with the mouse:
The Allegro Network Multimeter's internal database now works with the selected time interval so you can investigate what problems there were. The following points are easy to clarify on the Dashboard:
- TOP protocols: Endpoints in a network can experience increased and unexpected traffic such as large Windows updates. By clicking on the protocol you can see which IPs generated this traffic.
- TOP IP addresses: For example, there may be several backups running at the same time which burden the link and internal servers.
- TOP MAC addresses: If, for example, significant multicast or broadcast traffic appears here; this can indicate loops or similar issues, and a packet storm can place a heavy burden on a network.
- Is there extremely low or no network traffic during this period? This may indicate link problems such as no connection to the Internet or to another network node.
Let’s check by clicking on ‘Top protocols during selected interval’ for the cause of the slow connection.
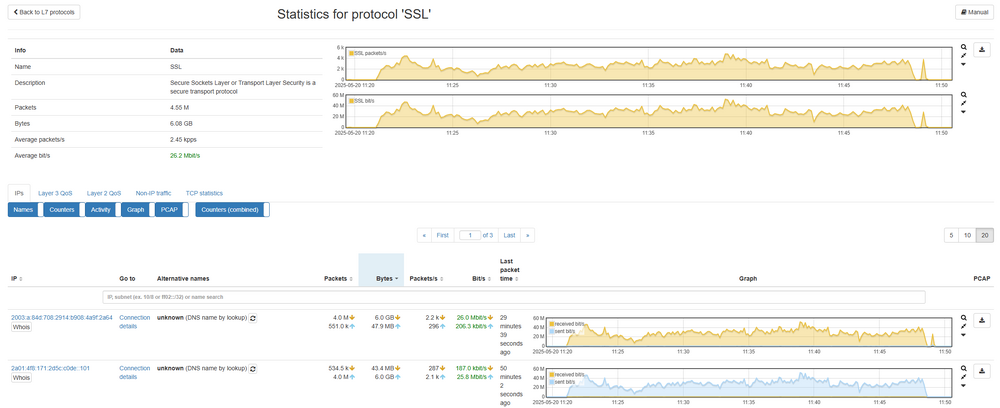
In our example, the ‘SSL’ protocol showed up with a large amount of packets transferred in the selected timeframe.
By clicking on ‘SSL’ under ‘Protocol’ you can easily see an overview of who triggered this traffic:
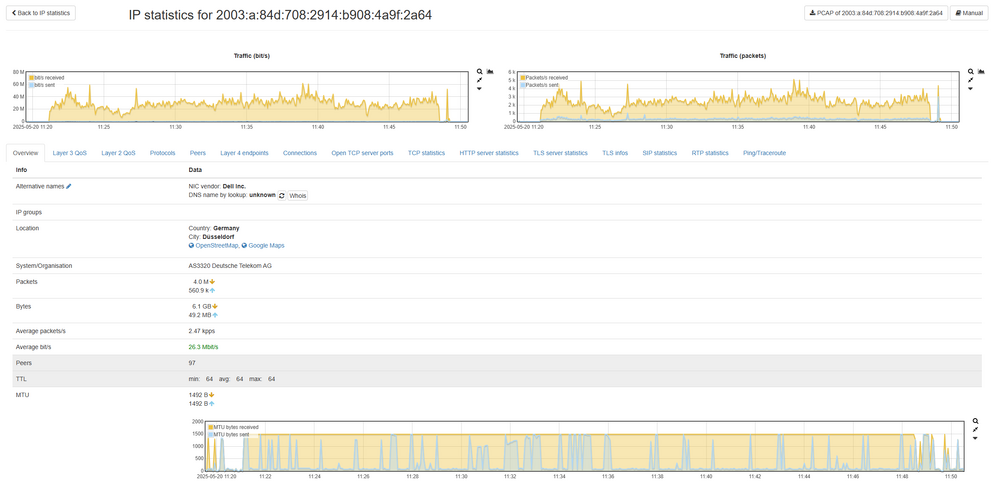
Here, in our example, on machine did a large download of 6 GB, which can lead to user disruption. By clicking on an IP address or clicking on ‘Connection details’ under ‘Go to’, you can further investigate the causes and even look into the IP’s connections:
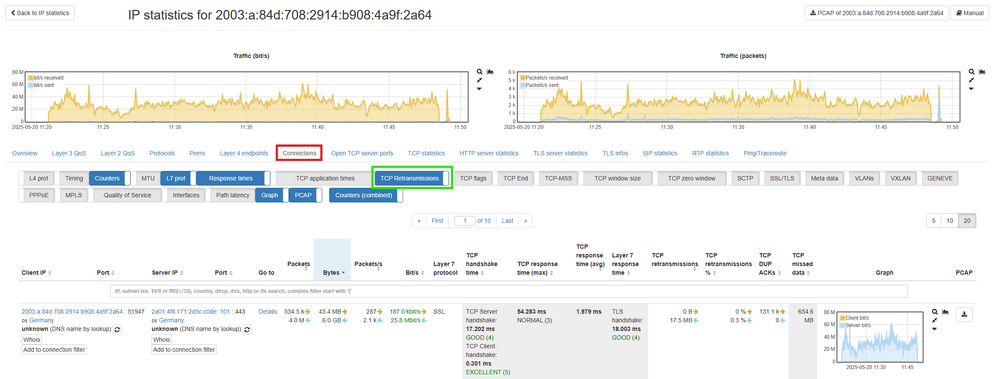
Under the ‘Connections’ tab you will find all connections the selected IP has made in the selected timeframe and you can even see the amount of TCP retransmissions that have been made
(to see the TCP retransmissions you might have to enable this option in your filter).
You can use the number of retransmission to estimate if there was a bottleneck between the sender and the receiver and if more packets had to be retransmitted.
Is there a high TCP retransmission? This could indicate an overload of the network segment or an WiFi device.
If you need a even more detailed analysis, you can use the pcap button to extract the connection packets.


