Investigate Network Load
Problem
How can you use the *Allegro Network Multimeter* to quickly and easily examine the load on a network? Let's take a practical example: Several users complain that their network connection is sometimes very slow. This occurred again this morning between 9 and 10 o'clock, for example.
Dashboard
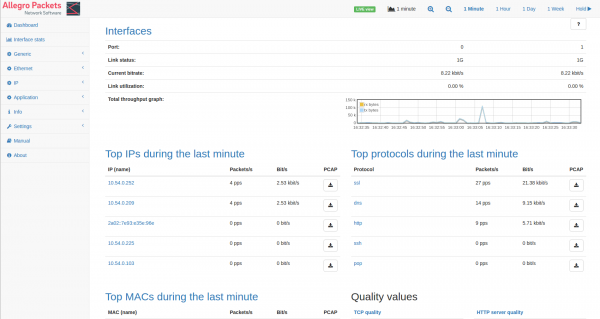
First we start with an overview in the dashboard. Open the web interface with your browser.
Time Selection
Now select a time view in the upper right corner, which is larger than your interval to be examined:
In our case, we are looking for events from this morning and I choose the last day's view. Now select the time period in which the users have reported problems by clicking with the mouse:
The Allegro's internal database now works with the selected time interval and you can investigate what problems there were here. The following points are easy to clarify on the dashboard:
- Do you know the TOP protocols? Endpoints in the network often cause further traffic, such as large updates for Windows. By clicking on the protocol you can see which IPs caused this traffic.
- Do you know the TOP IP addresses? For example, there may be several backups running at the moment, which burden your link and the internal servers.
- Do you know the TOP-MAC addresses? If, for example, a lot of multicast or broadcast traffic appears here, this can indicate loops or similar things, and a packet storm can place a heavy burden on the network.
- Is there a high TCP retransmission rate of more than 3% compared to other periods? This indicates an overload of a network segment such as the WLAN or an end device.
- Is there extremely little or no network traffic during this period? This may indicate link problems, such as no connection to the Internet or to another network node.
In our example, Dropbox showed up with a total of 900 MB data transfer. By clicking on "Dropbox" I can easily get an overview of who triggered this traffic:
Here the computer "nb-nina.allegro" has caused both upload and download
to dropbox with up to 40 Mbps. This can lead to user disruption caused by
the upload and download, allowing you to take further action.
By clicking on the IP and then on the tab "Connections" you can sort the connections by TCP retransmission:
You can use the quantity of retransmission to estimate if there is a bottleneck between the Allegro and the recipient and if more packets had to be sent again. Here in our example there were 1.4% retransmissions at approx. 12 MBit/s upload to dropbox. Probably the uplink was busy here and dropped several TCP packets.
If you need a more detailed analysis, you can use the PCAP button to extract the packets of a connection.


