Global settings
The Global settings section contains parameters for adjusting the behavior of the system. The settings are split among multiple tabs, described as follows.
Generic settings
Packet processing mode
This section allows for configuring the main packet processing mode:
- Bridge mode: In Bridge mode A.K.A. In-Line mode, all received packets will be transmitted between corresponding port pairs (e.g. 1+2, 3+4 on Allegro 500/510) so that the Allegro Network Multimeter can be placed in-line between any network component.
The device will operate transparent and will not modify network traffic in any way. The additional latency will be typically around or less than 1 millisecond.
In Bridge mode it is also possible to process network traffic from a mirror port or Tap. However, "only" half of the total available ports on each respective Allegro Network Multimeter model can be used to operate in this way. For example on a 4-port Allegro model 500, you can conveniently leave the unit in bridge mode and connect up to two mirror ports on interfaces 1 and 3 respectively. Aforementioned interfaces are physically separated and not an (in-line) interface pair.
Always avoid connecting mirror port traffic on an Allegro Network Multimeter interface pair (e.g. 1+2, 3+4 on Allegro 500/510), as this will result in TX traffic in the direction of a mirror port which if highly undesirable.

- Sink mode: In Sink mode, the Allegro Network Multimeter will operate "receive only".
Packets are not forwarded and there's no bi-directional traffic on any of the monitoring ports. This operation mode allows for installation at a Mirror port of a Switch or when using a network Tap to access the network traffic.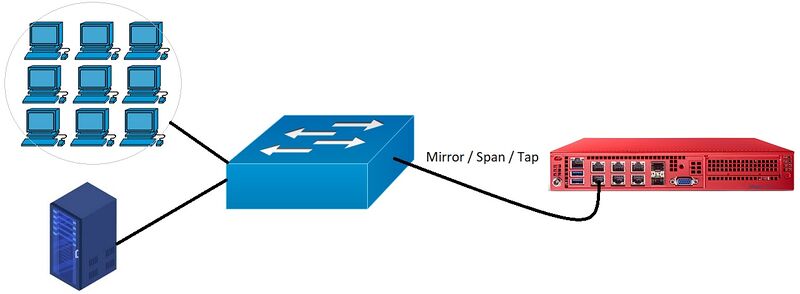

- Mixed bridge/sink mode: This mode enables to configure the packet processing mode for each interface pair. Interface pairs default to Bridge mode but the mode can be permanently changed in the interface statistics.
The packet processing mode can be changed during runtime.
Attention: Please always keep in mind, that while in bridge mode (Allegro Network Multimeter = in-line), a Link will be (shortly) interrupted when switching processing mode or/and rebooting the Allegro Network Multimeter.
Endpoint mode
If the endpoint mode is enabled for an interface, this interface will only process packets sent to the configured IP address (and potentially the port). If the system is running in bridge packet processing mode, links with an interface configured for endpoint mode will not forward traffic. The following types of traffic are supported:
- Ethernet packets encapsulated in GRE or GRE+ERSPAN and targeted for the configured IP address.
The system will process the packets as if only the inner encapsulated packet is seen and any traffic captures will only contain the encapsulated packet. - UDP packets to specific port (packets will be analyzed as is).
An interface with endpoint mode enabled will respond to ARP requests and to ICMP echo requests so it is possible to use ping to verify that the interface is reachable under the configured IP address.
It must be noted that if the system is running in bridge packet processing mode, any links with an interface configured for endpoint mode will not forward traffic.
VLAN tag handling is not supported. The Allegro Network Multimeter will accept ARP and ICMP requests with any VLAN tags but will send replies without VLAN tagging.
Note: In versions 3.0 or older, the mode was named "l3 tunnel mode".
Webshark support
The Allegro Network Multimeter allows having a preview of packets, directly in the browser. This is the so called Webshark. To support Webshark previewing, the Allegro Network Multimeter needs to reserve an amount of system memory.
This reserved amount of memory (RAM) is configurable and will not be available for the In-Memory database, thus the history of stored statistics in the dashboard becomes a little shorter. If this is not desired, it is possible to disable the Webshark support.
Multiple parallel sessions/instances of Webshark previewing within one Allegro Network Multimeter is possible. The number of simultaneous Webshark instances and max. preview file size (e.g. 5MB) are configurable but may vary depending on Allegro model and installed RAM.
Changing Webshark parameters requires a restart of the processing.

Snort analysis
Beta Feature
This feature is still in active development and is therefore subject to changes in the future. There may be bugs or unexpected behavior when using this feature.
The Allegro Network Multimeter is able to perform intrusion detection based on the Snort software project. The detection can be performed on live traffic or ring buffer traffic. This analysis is invoked via the capture dialog on any page and respects the same capture filter expressions as a normal traffic capture.

This feature is disabled by default, to enable it navigate to Global Settings > Snort Analysis and enable it via the toggle switch. Once enabled a new setting will appear to regulate the allowed memory usage by the intrusion detection as well as the rules and configs used by Snort. The user is able to set a hard maximum limit on the usable memory, and if the Snort process exceeds this limit it will be killed by the OOM-Manager. Additionally, another soft memory limit will be installed just below the hard maximum, and if the process reaches this limit it will be throttled heavily. If your intrusion analysis appears to get stuck or is unusually slow, a good troubleshooting step is to increase the memory limit. It is generally not recommended to keep the memory limit below 200MB.
A more detailed guide on how to use the rule and config editors can be found here.
Detail of traffic analysis
Limit module processing, allows you to configure which OSI-layers (2,3,4,7) are actively processed and analyzed by the Allegro Network Multimeter. With this setting, the performance of the Allegro Network Multimeter can be significantly improved and allows for higher throughput when disabling some analysis modules.
For both realtime and offline parallel analysis, the following modes are possible :
- Only capturing: Only interface statistics and the capture module is provided. Capture filters are supported without Layer 7 protocol specification/recognition.
- Capturing and protocol detection: Additionally Layer 7 protocol specification in Capture filters will now work.
- Up to Layer 2: Additionally all Layer 2 related modules are active such as MAC, MAC protocols, ARP and Burst Analysis.
- Up to Layer 3: Additionally all Layer 3 related modules are active such as IP and DHCP statistics.
- Up to Layer 4: Additionally all Layer 4 related modules are active such as TCP and Layer 4 server ports.
- Unlimited: All Allegro Network Multimeter modules are active.
When switching to another mode you need to restart the processing in order to activate the new settings.
NOTE: The data recorded to/stored in the Packet Ring buffer, will NOT be affected by any of the above settings. Packet ring buffer capture rules may be configured under "Generic - Packet Ring Buffer", further explained in our wiki here https://allegro-packets.com/wiki/Packet_ring_buffer#Packet_ring_buffer_snapshot_length_filter
Enable single flow load balancing
When the Limit module processing slider is turned to Only capturing the option to enable single flow load balancing appears. If this option is enabled, even a single flow is load-balanced to different analyzer threads.
This is only recommended when there are very few flows and there is an imbalance in the load of the analyzers. As the packets of a single flow are processed by different analyzers the packets of the flow may be stored out-of-order in the Packet Ring Buffer and a larger amount of memory may be required to reorder the packets when capturing from the Packet Ring Buffer (see Capture module configuration settings).
Graph detail settings
It is possible to modify the detail level of all graphs in the interface. This settings allow you to see a more detailed view (with higher time resolution) or to reduce the detail level so more data can be stored on the device. Changing the default values has an impact on the performance and memory usage. Changing a slider to the left increases the detail level of graphs, but increases memory usage and decreases performance.
- Best graph resolution: This option configures how detailed the graph information are shown in the best case (the latest information). The default value is one second which means that a graph sample point represents a second of packet time. You can change the resolution up to 1 millisecond which gives a detailed sub-second representation of the traffic. You can also decide to decrease the resolution which enables the Allegro Network Multimeter to store more data for a longer period of time.
- Reduce graph resolution of old data by up to: The resolution of older graph data is automatically reduced to save memory and to allow a longer view into the traffic history. This option allows you to change this behaviour. With a reduction factor of 1/1 no reduction is done at all which means the selected graph resolution is available for the complete time.
- This reduces the time period to see historical data. You can choose to increase the reduction factor to store more data for a longer period. The time printed in parentheses represents the worst-case graph resolution based on the chosen resolution and reduction factor. The reduction is done in multiple steps up to this limit. The newest data always has the highest resolution defined by the "Best graph resolution" setting above. Between 60 and 120 data points are stored at a minimum, so with default resolution of 1 second, between one and two minutes are available in the highest resolution. Due to internal compression, the exact number of data points cannot be foreseen but 60 data points are always available at least, usually much more. Once the limit is reached, data is reduced by a factor of two thus doubling the amount of time available in half resolution (2 to 4 minutes in 2 second resolution). When the next limit is reached, the data is halved again thus doubling the time again, until the configured reduction limit is reached. With default settings of one second resolution and reduction limit of 1/6, the worst resolution of 64 seconds (or 1 minute and 4 seconds) is reached not before 2 hours into the past. The drop down menu in graph view gives an exact number about the available graph resolution in the given time period.
Note: Regardless of these settings, the graph values are always converted to represent a value per second (when applicable). For example, the packets per second for an IP addresses will always be a value literally per second even if the resolution is larger or smaller than one second. The displayed value is scaled to match this view. Especially with sub-second resolution this might be misleading.
For instance, if there is a network element sending one packet per second and the resolution is set to 100 milliseconds, the value shown in the graph might be shown as 10 packets per second as each sample point is scaled to represent an value per second.
For a detailed investigation it is recommended to always select a specific time interval and look at the (packet) counters shown in all statistics since these are unscaled and represent the actual values.
Performance implications: The performance degradation and memory usage depends on the actual network traffic and is not exactly predictable.
Here are some examples for reference on a Allegro 1000 series with different configuration values (under ideal test conditions):
- 1 second resolution, 1/1 reduction factor: 90% of default performance
- 100 millisecond resolution, 1/1 reduction factor: 50% of default performance,
- 10 millisecond resolution, 1/1 reduction factor: 15% of default performance
- 1 millisecond resolution, 1/1 reduction factor: 10% of default performance
PCAP parallel analysis
The PCAP parallel analysis feature allows to analyse PCAP files or the packet ring buffer in parallel to the live measurement. The settings allow to enable the feature and choose how much memory of the main memory is used for parallel analysis and how many parallel slots can be used. Detailed description of the configuration values are described here.
IPFIX settings
The Allegro Network Multimeter may be running as an IPFIX exporter. These settings allows for reporting configuration. When enabled, the following settings are possible:
- IP address: Address of IPFIX collector.
- Port: Corresponding port.
- Protocol: TCP or UDP.
- Update interval: Interval in seconds for sending a status update of flows.
- UDP resend interval: Interval in seconds for resending IPFIX templates for UDP connections.
- TCP reconnect timeout: When TCP connections could not be established, wait for this time period until the next attempt to establish a connection.
Individual IPFIX messages can be enabled or disabled by toggling corresponding options. See the NetFlow/IPFIX interface documentation for details about the message types.
Time settings
The Time settings were moved to Time settings.
Email notification
The Email notification settings were moved to Administration.
Long-term DB and persistence (BETA)
These two features allow to use a storage device as additional memory for long-term statistics of selected values, and to use a storage device to store and restore measurement data between restarts. See Longterm DB for more details.
Expert settings
The Expert settings contains parameter which are only necessary to change in rare installation scenarios or some specific need for a different operation mode.
Packet length accounting
This setting allows you to configure which packet length is used for all traffic counters and incidents. The following modes are possible:
- Layer 1: Packet length is accounted on Layer 1 including preamble (7 Byte), SFD (1 Byte) and inter-frame gap (12 Bytes)
- Layer 2 without frame check sequence (default): Packet length is accounted on Layer 2 without a frame check sequence (4 Bytes)
- Layer 2 with frame check sequence: Account packet length on Layer 2 with frame check sequence (4 Bytes) When switching to another mode, it will only be applied on new packets. Older packet size statistics will not be changed.
VLAN handling
The Allegro Network Multimeter can ignore VLAN tags for connection tracking. Enabling this option may be necessary if network traffic is seen on the Allegro Network Multimeter that contains changing VLAN tags for the same connection. For example, depending on the configuration of the Mirror Port to which the Allegro Network Multimeter is connected, incoming traffic could contain a VLAN tag while outgoing traffic does not. In this example, a connection would appear twice in the statistics which often is desired behaviour to be able to identify a network misconfiguration. In some cases however, such "duplicate" data in the dashboard may be misleading, and the user would want to see only one connection. In these scenarios the option ignore VLAN tags may be enabled.
Tunnel view mode
The Allegro Network Multimeter can decapsulate GRE, VXLAN, ERSPAN type II and type III, GENEVE, CAPWAP as well as L2TPv3 data traffic. Depending on this option either the outer tunnel or the inner content is shown in all analysis modules.
There are three possible modes:
- don't decapsulate traffic (default)
- decapsulate tunnel traffic, discard non-encapsulated traffic
- decapsulate tunnel traffic, process also non-encapsulated traffic
Optionally, a filter can be set to limit decapsulation on specific packets with a certain IP address, IP ranges or interfaces. If the filter is empty, all packets will be decapsulated.
In case the mode is active with discarding non-encapsulated traffic, on the Dashboard a dropped counter will display dropped non-encapsulated packets.
When capturing, packets with complete outer Layer 2, Layer 3, GRE, ERSPAN, GENEVE, CAPWAP and L2TPv3 headers will be stored as seen on the wire.
Database mode settings
The database mode is a special analysis mode for high-performance Allegro Network Multimeters with multiple processors to increase the performance on such systems. It is normally enabled automatically but depending on the actual network traffic and system usage, some parameter tweak might be necessary to improve overall system performance. You should only change these parameters in discussion with the Allegro Packets support department. These settings are only visible if your Allegro Network Multimeter is capable of running this mode.
You can read more about the meaning of the settings here.
Network performance
There are several network performance settings available to improve performance on high-performance systems in case of packet drops during very high incoming bandwidth. They are only visible if your Allegro Network Multimeter is capable of changing these settings.
- Max RX queues per socket: This setting specifies the quantity of threads dedicated to read and write interactions with the network interface controllers. By increasing this value, network receive bandwidth can be increased before packet drops occur. By decreasing this value, data analysis will improve. The default setting of 2 RX queues is suitable for most configurations since data analysis typically needs much more processing ressources.
- Use Hyper-Threading for RX queues: This setting allows enabling or disabling Hyper-Threading for the threads dedicated to read and write interactions with the network interface controllers. By disabling it, network performance can be improved as the RX queues will be distributed to physical CPU cores only. By enabling it, RX queues will also be distributed to virtual Hyper-Threading CPU cores which is not as efficient as physical CPU cores. By using Hyper-Threading, data analysis will improve since there are more CPU cores available for these tasks. Hyper-Threading is used by default. This is suitable for most configurations as data analysis typically needs much more processing ressources.
- Preferred Network interface controller: This setting allows fine tuning of network and data analysis performance for dedicated network controllers. The selected set of network controllers will be preferred over others. Usually the fastest or the network controller with the most traffic should be preferred. The Auto setting is used by default, preferring the fastest network controller.
You should only change these parameters in discussion with the Allegro Packets support department.
Processing performance
Processing performance may be modified on high-performance systems. This is only visible if your Allegro Network Multimeter is capable of changing this setting.
- Processing performance mode: This setting allows for fine tuning processing performance. By using Analysing, as much processing ressources on all CPUs as possible are used for data analysis. By using Capturing, the focus will be on high data throughput and low latency for capturing purposes by using only the CPU where the preferred network controller is attached to. This has an impact on data analysis performance. Analysing is used by default.
You should only change this parameter in discussion with the Allegro Packets support department.
Packet ring buffer timeouts
Two timeout settings related to the packet ring buffer can be adjusted.
- Long timeout controls after which maximum amount of time, a packet is actually written to the packet ring buffer. A lower value may decrease the time difference by which packets are stored out of their order in the packet ring buffer but it may increase the amount of unused overhead data in the packet ring buffer.
- Short timeout controls after which amount of time smaller batches of packets are written to the packet ring buffer, even if waiting for more packets would result in a more efficient operation. A lower value may decrease the time difference by which packets are stored out of their order in the packet ring buffer, but it may also decrease the performance of the packet ring buffer.
Data retention timeout
When the data retention timeout is set to a value greater than 0, data will be removed everywhere throughout the system after the given number of minutes. This means that entities like IPs, which have been inactive for longer than the timeout, will be removed. History graph data for entities that are still active will be truncated to cover only the given timespan, while the absolute values for the whole runtime will be retained. When a packet ring buffer is active, packets which are older than the timeout will be discarded.
Multithreaded capture analysis
This option enables the use of multiple CPUs for capture analysis like when analyzing a pcap capture file or analyzing the packet ring buffer. Depending on the number of available CPUs this can significantly speed up the analysis.
It is possible to dedicate a number of CPUs exclusively to capture analysis. Since these CPUs are not available for live packet processing the performance of live traffic analysis may be lower. When set to 0 a lower priority is used for capture analysis than for live analysis but it cannot be ruled out that the performance of the live processing is affected.
Load balancing
This option select the load distribution method. By default, network traffic is balanced among all processing threads based on the IP addresses. This is fast and usually the best way for efficient load balancing.
If the network traffic only occurs between a few IP addresses, this method can lead to a load imbalance so that some threads are doing more work while other threads may be idle. In this scenario, "flow based balancing" can be enabled to distribute the traffic based on the IP and port information. This will lead to better utilization of all processing threads.
Since this option induces additional processing overhead per packet and additional memory for all internal IP statistics, it should only be enabled in cases of significant load imbalance.
Ingress packet memory
This slider allows to configure the amount of memory which is used to buffer received packets. A larger amount of ingress packet memory may help in processing bursts of high bandwidth traffic without packet drops but it also decreases the amount of memory available for statistics. It is important to know that a restart of the processing does not suffice to make changes to this setting active. A full reboot of the device is required for that. See Performance Optimization Guide.
Jumbo frame mode
This options allows to set how jumbo frames are handled by the system.
Three settings are available and the normal mode, which is also the default, is the mode that was used before this configuration option was introduced:
- Normal: the default mode offers the best balance of full support for jumbo frames with an efficient usage of the ingress packet memory. This mode uses efficiently sized packet buffers and splits larger packets over multiple packet buffers.
- Large buffers: this mode uses a single large buffer for each packet which may improve the performance but does not use the ingress packet memory as efficiently and limits the maximum jumbo frame size to 9kB.
- Disabled: this mode disables support for jumbo frames and offers the best performance and efficient usage of the ingress packet memory. Jumbo frames will be discarded by the network interface.
Hardware packet timestamping
This option allows to enable the use of high-precision hardware packet timestamps on supported interfaces. If an interface is supported, it has the “Hardware Timestamps” feature in the interface statistics (firmware >= 4.4).
This feature will require approximately 30% more load in the I/O threads. The load increase can be reduced to about 10% by using the jumbo frame mode "Large buffers" or "Disabled".
When enabled, packets received on supported interfaces will carry a timestamp with nanosecond resolution instead of microsecond resolution.
Time synchronization for hardware packet timestamping
Except when the network interface supports GNSS/GPS time synchronization and this has been selected as type of time synchronization (see Administration time settings) the internal clock of the interface is synchronized to the main device system clock. Even when no time synchronization method is chosen ("none") the system clock is free-running and the internal clock of the interface will be regularly synced to the system clock.
The synchronization to the system time happens roughly every 5 seconds. When the interface clock deviates more than 500ms from the system clock (should only happen at startup or when there is a big jump in the system time e.g. when changing the time synchronization method) the interface time is immediately reset to the system time. If there is a smaller deviation from the system clock the frequency of the interface clock is gradually adjusted to make the clock anneal to the system time so to avoid any discontinuous jumps of the packet timestamps.
When "GNSS/GPS" time synchronization has been configured and the interface is receiving a valid GNSS/GPS time signal the interface clock is directly disciplined to the GNSS/GPS time signal and the system clock is synchronized to the GNSS/GPS time. Information of the synchronistation status is display on the System Info page. Interfaces with hardware packet timestamping but without a GNSS/GPS connection will continue to be synchronized to the system time (which is now running much closer to the global GNSS/GPS time).
External timestamps
When this option is enabled, the system will use timestamps contained in the packet data instead of timestamps measured at packet arrival. Currently the Arista and Ixia/Keysight as well as the SRCMAC timestamp formats are supported.
If the Ixia/Keysight or Arista type is selected, packets without an external timestamp will not be analyzed. The current number of packets that are dropped because they do not contain an external timestamp is displayed in the active interface overview table of the top-user dashboard. If there are no packets with external timestamps arriving the time of the packet processing will effectively stand still and most graphs will not make progress in live-mode.
If one of the SRCMAC options is selected, all packets will be analyzed with all-zero MAC addresses.
External original packet lengths
This option allows to enable the use of original packet length information contained in the packet data instead of the length of the packet as received. This is especially useful if truncated packets are received and the traffic statistics should still show the original traffic amount.
At this time only the Ixia/Keysight original packet length trailer format is supported. In firmware version >= 4.6, the length in the IP header can also be used as information about the original packet length. A type selector allows to choose the corresponding format.
This feature can also be used in combination with the External timestamps option to support packets that contain a Ixia/Keysight trailer with both timestamp and original length information.
Memory utilization limit
This option allows to reduce the limit until old data is removed from the in-memory database. By default the system tries to target 90% memory utilization. In some case, the load might be too high to match this limit. A smaller limit may enable the system to keep the target memory utilization and perform better in general.