Interface statistics
The interface statistics page lists all network ports that are utilized by the Allegro Network Multimeter. To easily focus on the currently used network interfaces, unused interfaces can be hidden via the checkbox to show only active interfaces.
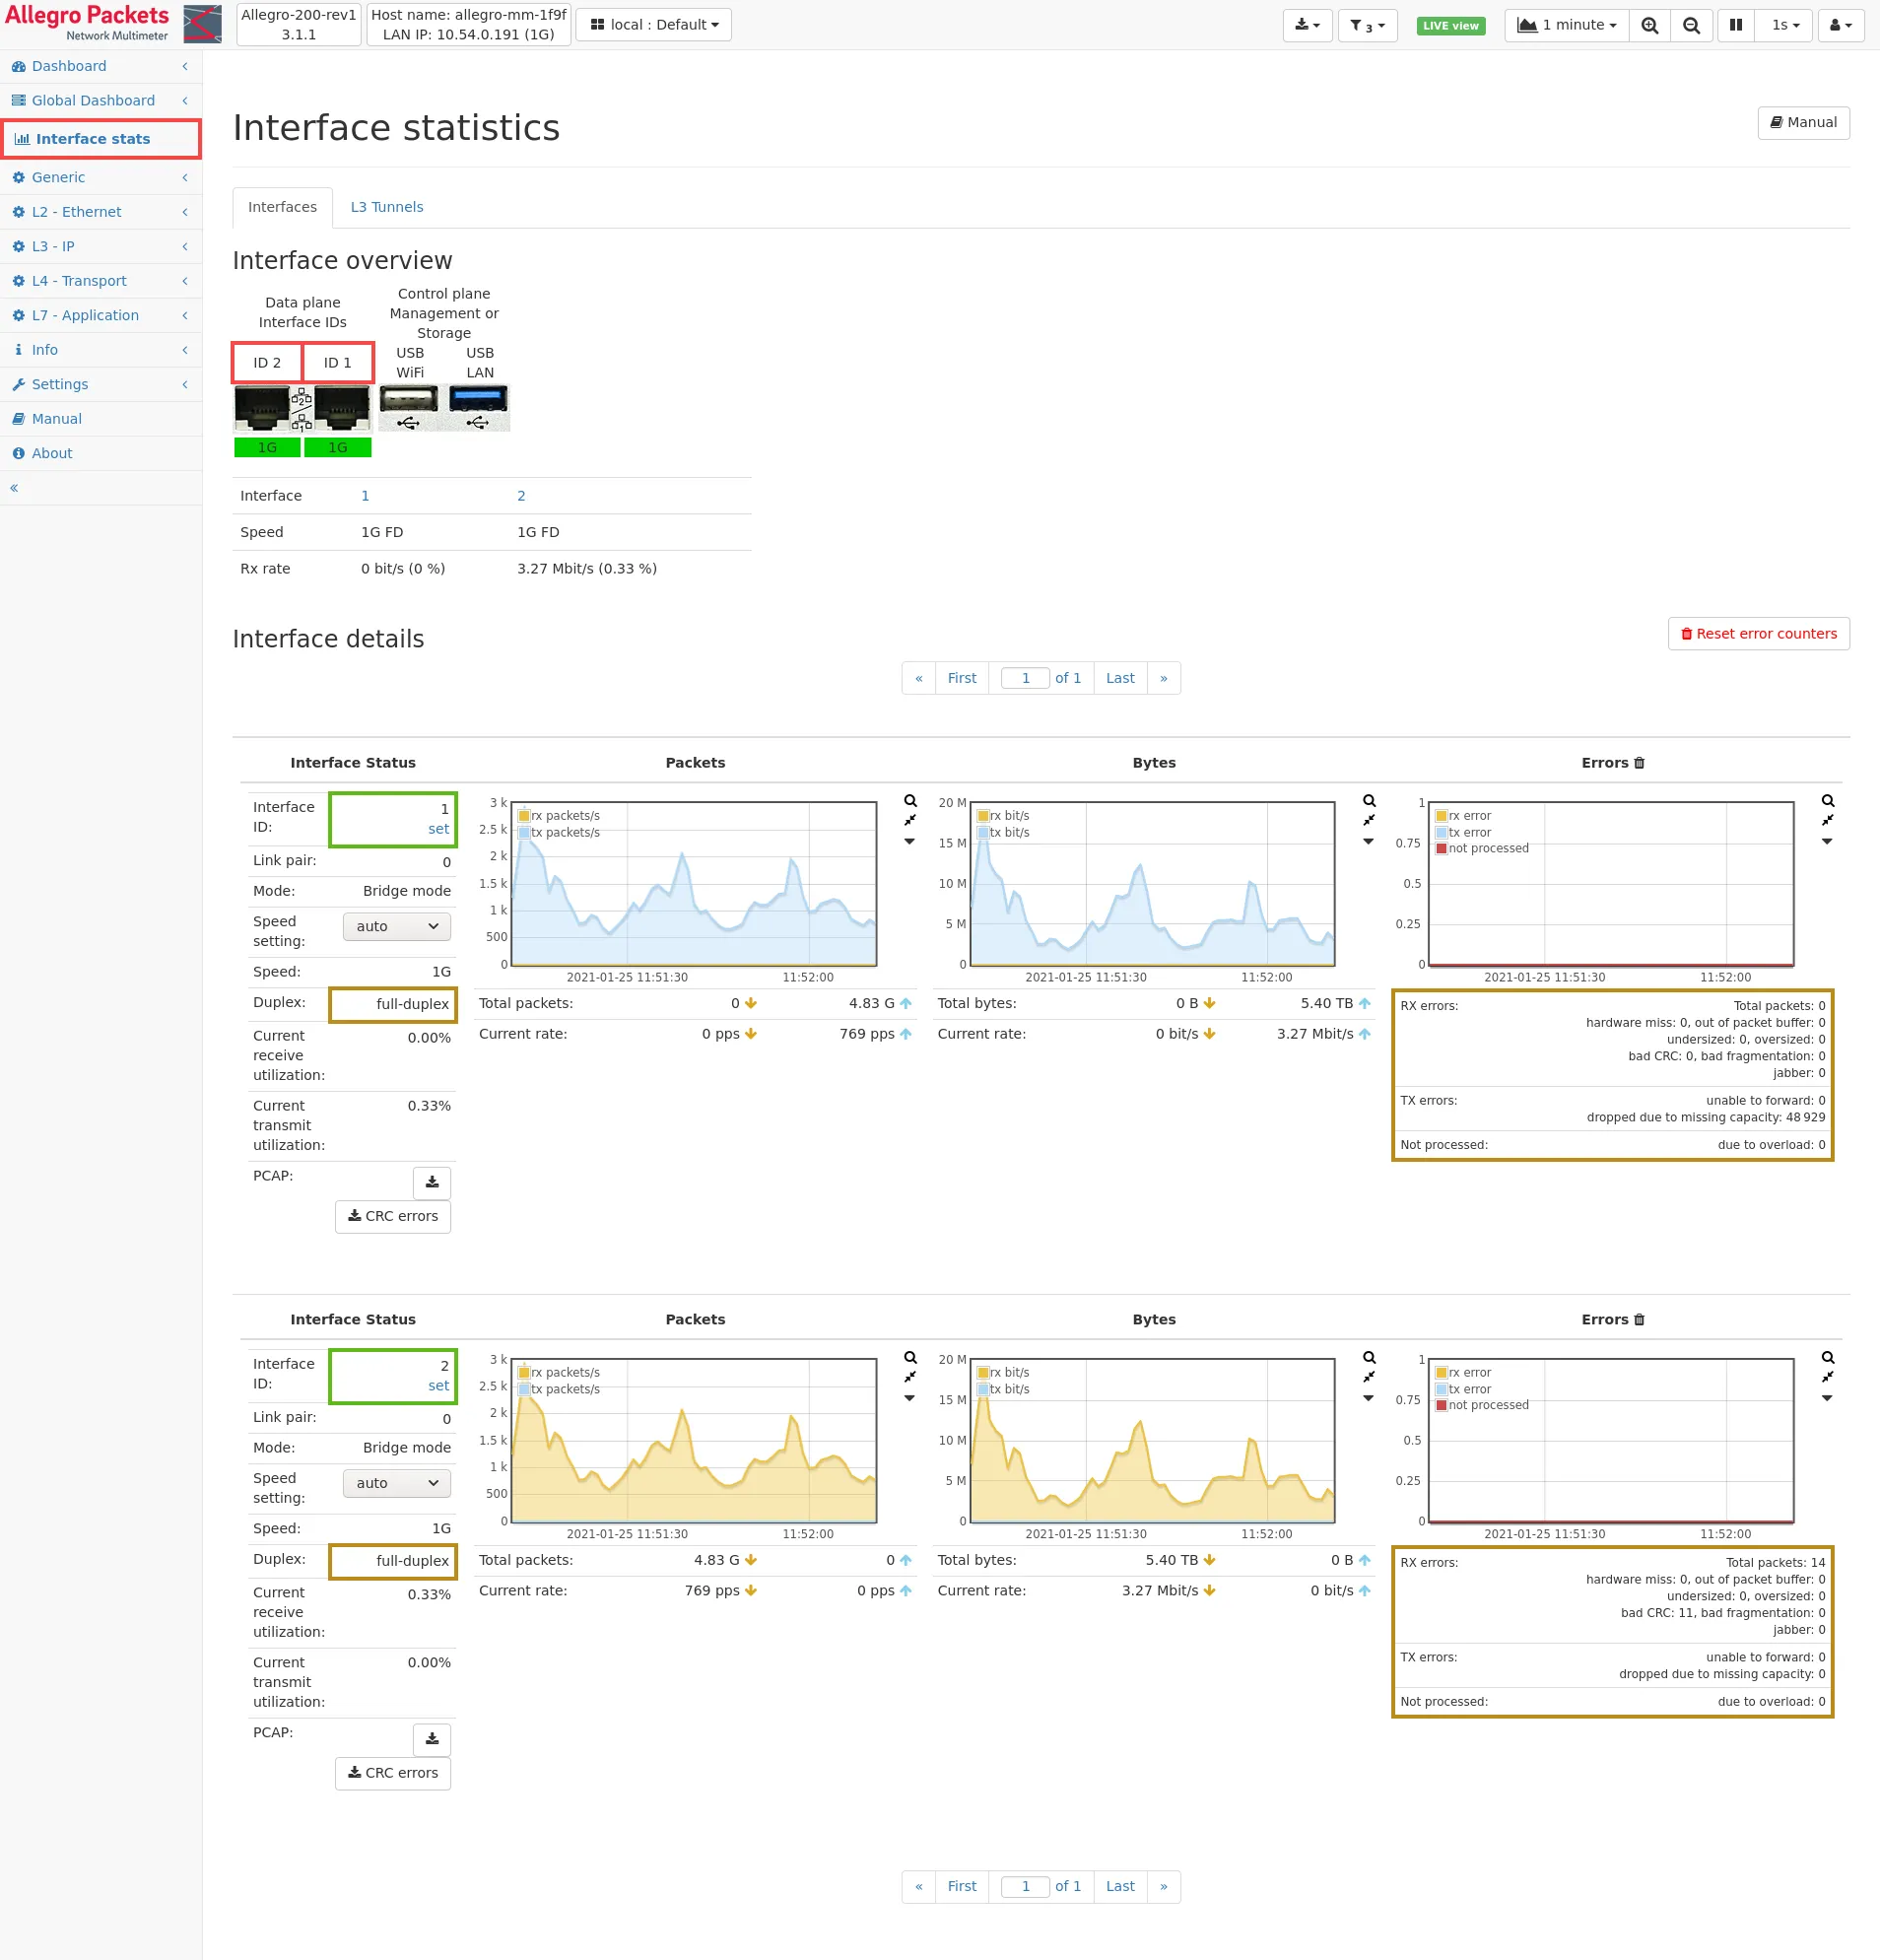
The Interface status column contains generic information about each port:
- The Interface ID is a unique number enumerated for all network ports.
- Link pair: This number covers two ports linked to each other in the bridge mode or mixed bridge/sink mode. That is, traffic received from one port of the same link pair will be sent to the corresponding port of the same link pair, and vice versa. In sink mode, the link pair number is irrelevant as no traffic is forwarded.
- If the packet processing mode Mixed bridge/sink mode has been enabled in the Global settings a drop down menu appears and the packet processing mode for the interface can be chosen. A selection here automatically affects the other interface of the link pair. Single interfaces which are not part of a link pair do not show the drop down menu as they always operate in Sink mode.
- Module: The Info button opens a dialog that shows SFP-Module information like the vendor name or serial number or metrics like the signal strength or temperature, if available.
- Speed setting: This offers a possibility to change the speed of the port. A selection of all possible settings is presented. The default selection is auto for the highest possible speed. This selection also has the option disabled to permanently disable the interface and bring the link down.
- Autoneg: This checkbox can be used to select if the interface uses autonegotiation or not. It may help to disable this setting if the connected device requires a fixed speed without autonegotiation.
- Speed: Indicates whether a network cable is connected and which link speed has been negotiated.
- Duplex: Shows whether the link is operated in full-duplex or half-duplex mode.
- Features: Special network card hardware functions (Firmware >=
4.4):
- Bypass: Hardware bypass
- PoE: Power over Ethernet
- HWTS: Hardware Timestamps
- GNSS: Global Navigation Satellite System (GNSS) Time
- Maximum frame size: Shows the largest Ethernet frame size that can be received on that interface.
- In case the Allegro Network Multimeter operates in bridge mode and two mutual interfaces do not have the same link speed and duplex, a warning will be shown below the Duplex status for both interfaces.
- Current receive/transmit utilization: Summarizes the traffic received and sent by the network port. The value is calculated by the number of bytes received and sent in relation to full-duplex link speed.
- Clock synchronization: Is shown for GNSS/GPS-capable interfaces when the GNSS/GPS time synchronization method is enabled (see Administration). It shows either GNSS/GPS or PPS depending on the clock source of the interface. If not locked is displayed behind the synchronization source this means that the internal DPLL synchronization circuit is not yet fully locked onto the source clock signal. It may take several minutes after activation for the DPLL to lock onto the clock source.
- Clock offset: Is shown for GNSS/GPS-capable interfaces when the GNSS/GPS time synchronization method is enabled (see Administration). It shows the time offset in nanoseconds at the last synchronization between the interface clock and the DPLL synchronization circuit driven either by GNSS/GPS or PPS.
- PCAP: The button allows capturing all traffic for that network port.
Next to the Interface status there are three graphs for the number of processed packets, the number of processed bytes, and possible error counters.
Both packets and bytes statistics show past values in the graph and the current total values and the current rate during the last second, separately for receiving (yellow down arrow) and sending side (blue up arrow).
The error values list all possible packet processing errors. Depending on the network interface card’s capabilities, slightly different counters are shown.
RX errors apply to received packets. The following errors are counted:
- Malformed packets: The packet was corrupt. This is a general receive error counter and more detailed counters will be reported below.
- Hardware miss: The packet couldn’t be received by the network interface card.
- Out of packet buffer: There have been problems with allocating memory for the packet.
- Undersized: The packet was shorter than the minimum size of 64 Bytes and had a valid CRC.
- Oversized: The packet exceeded the defined MTU.
- Under or oversized: The packet was either too small or it exceeded MTU.
- Bad CRC: Frame check sequence of layer 2 was broken.
- Bad fragmentation: The packet was shorter than the minimum size of 64 Bytes and had a bad CRC.
- Jabber: The packet was longer than the MTU and had a bad CRC.
TX errors indicates errors when sending to the wire fails for some reason.
- Unable to forward: This is a generic error counter.
- Dropped due to missing capacity: The packet could not be sent as the link capacity was too small.
Not processed packets were dropped due to overloaded software send queues.
L3 tunnel stats
Section titled “L3 tunnel stats”If the Endpoint mode (see Global settings) has been activated for an interface or the Tunnel View Mode is used this tab will show a list of the L3 tunnels processed by the system. It shows the source IP address along with the target IP address (see Common table columns - IP) and provides statistics about the amount of traffic transmitted through the tunnel. In case of ERSPAN tunnels the ERSPAN session ID will also be used to differentiate between tunnels in addition to the IP addresses.
Link state propagation
Section titled “Link state propagation”Since bridged interfaces are implemented as a software bridge, any link changes behind the Multimeter are effectively masked by the bridge. Propagation of the link state through the bridged interfaces can be enabled via the checkbox labeled “Link state propagation” located in the interface status box. This means, if the device connected to one side of the bridge goes down, this change in link state will be reflected on the other side of the bridge, allowing monitoring devices to see the status of devices behind the Multimeter.
WiFi interfaces
Section titled “WiFi interfaces”If WiFi monitoring interfaces are active a tab named WiFi interfaces is available. This displays statistics for each active WiFi monitoring interface similar to the statistics on the Interfaces tab.