Incidents
Incidents are used to alarm the user when configured network events occur, usually for traffic based rules, but also for system-specific events. These notifications can be viewed in the web GUI and may also be delivered on various notification channels. Repeating incidents are counted as such and the time of the first and last occurrence of an incident is remembered. This feature can be disabled for some incidents. What makes an incident unique depends on the type of incident.
The incident feature allows to define rules which are checked on the configured trigger point, like when a connection ends, a SIP call ends, or for checks on ongoing traffic. When such a trigger hits, configurable traffic attributes will be checked and if all attributes of a rule match, an incident is created.
Occurred incidents can be seen in the web interface, additionally reporting via the following notification channels is possible:
- Apache Kafka
- SNMP trap
- syslog
The first occurrence of a medium or high severity incident will also trigger a status notification which is visible at the top right of the web GUI.
A configurable number of incidents will be remembered by the system and if the limit is exceeded the oldest incidents will be discarded [fixed number of 1000 incidents in firmware < 4.1].
Rule configuration
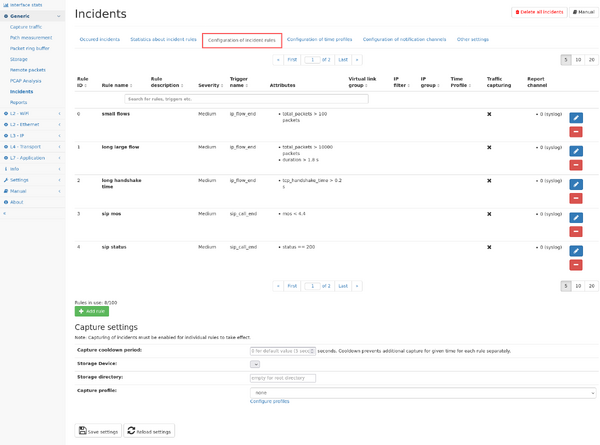
Incident rules can be defined in the Incident rules" tab in the menu "Generic -> Incidents". All changes to the rule configuration will only take effect after saving the current configuration by clicking on the save button at the bottom of the page.
The page shows a table containing the existing rules and their configuration.
Each existing rule can be modified by clicking on the pencil symbol, or deleted by clicking on the "minus" symbol.
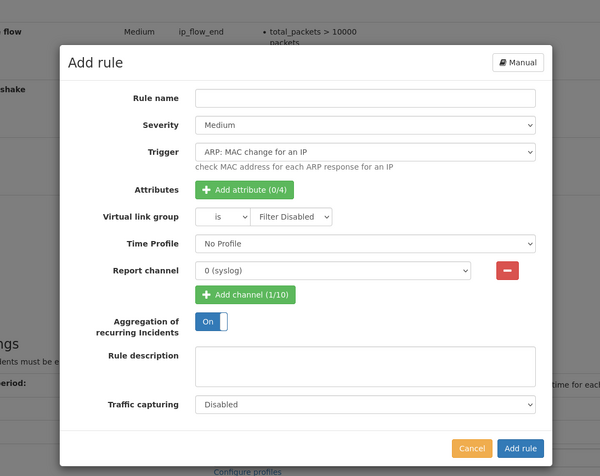
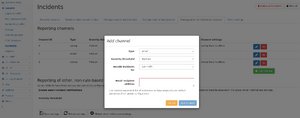
New rules can be added by clicking on the "Add rule" button. A dialog appears allowing for configuration of the rule. The same dialog is used when modifying an existing rule.
Add/modify a rule
A rule is defined by the following settings:
- Rule name: This is an arbitrary text describing the purpose of the rule. This text is shown in the incident list and email/Kafka/SNMP trap/syslog ouptut.
- Severity: three different severity values "low", "medium", and "high" can be used to group more important and less important incidents. Reporting channels can be configured to only report incidents of a minimum severity level. A rule can also be disabled by choosing the severity level "disabled". It will not be evaluated and can be enabled later at will.
- Trigger: The trigger defines when a rule is evaluated. For each available trigger, a description is shown next to it giving more details about the trigger. Some triggers are evaluated at a very specific time, like when a VoIP call ends, or are evaluated regularly like for throughput triggers of IP traffic which can be configured to be checked periodically. See list below for a detailed description of the available triggers.
- Attributes: Attributes are used to make actual comparison of expected values vs. actual values.
- Each trigger has a different set of attributes which can be checked for, and some triggers don't need to have an attribute at all. See list below for a detailed description of the available attributes
- Up to four attributes can be added by clicking on the "Add attribute" button.
- Multiple attributes must all match at the same time to let the rule create an incident.
- Each attribute can be compared to a specific value, so that the actual value is lower, equal, or greater than a defined value.
- Some attributes have an additional parameter, like a time span which defines how the attribute value is calculated.
- Virtual link group: The rule can be limited to a selected virtual link group or to be applied for any group. Some triggers cannot be limited to a virtual link group so the configuration will be hidden.
- IP filter: Depending on the selected trigger, the rule can be limited to a specific IP address. The IP filter can also be an IP subnet in the format IP/mask-length (Example: 10.0.0.0/8)
- IP group: Depending on the selected trigger, the rule can be applied to an IP group instead of an individual IP address.
- Virtual link group, IP and IP filter can also be used inversely by using the != comparator
- Report channel: Incidents are always visible in the web interface, but can also be reported via multiple channels which can be configured separately in the tab "Notification channels". Up to ten channels can be selected so that the incident for this rule is reported on each channel. Also, no channel can be configured so the incident is only accessible on the web interface.
- Aggregation of recurring Incidents: Incidents are aggregated by default. This means the table only shows the number of incidents of the type and the timestamps of the first and the last incident. This can be disabled for most of the incidents, so that you are able to see every indent of the incident-type.
- Time Profiles: You are able to set a profile which defines the active time of an incident rule.
- Traffic capturing: If supported by the trigger, the rule can be configured to capture the network traffic triggering the rule, including some extra time before and after the incident.
- Possible options:
- Disabled: capturing is disabled for this rule
- Live traffic: capturing happens only for live network traffic
- Replay traffic: capturing happens only for replayed network traffic (from PCAP files)
- Always: capturing happens in all traffic processing types.
- Extra capture time: configure the number of seconds before the start of the incident and after the end of the incident.
- If a time span parameter is used for attributes, the capture time includes this time duration as well.
- The traffic is automatically filtered to only contain the traffic that actually triggered the rule, i.e., an IP address or an IP group for IP rules. See the list below of the available triggers for more details about the applied filter.
- Possible options:
- Trigger cooldown: Depending on the selected trigger, once the incident was activated and finished, the trigger will wait for this cooldown period before the next incident may be triggered again. Each rule will have a seperate cooldown timer. The cooldown period may be configured in seconds.
Available triggers
| Trigger name | Description | Attributes | Attribute usage | Traffic capture filter |
|---|---|---|---|---|
| ARP: MAC change for an IP (arp_ip_mac_changed) |
This trigger is checked on an ARP response and MAC address changed for a requested IP. | time_since_last_mac | optional | L2 protocol type ARP |
| DNS: Server is not responding (dns_server_not_responding) |
This trigger is checked when a DNS server is not responding for some time. A server is considered unresponsive when more than 3 requests to the DNS server went unanswered for a period of more than 5 seconds. Such a server must have answered at least two requests previously. | time_since_first_unanswered_request | optional | IP address,
server port 53 |
| DNS: Server response error (dns_server_response_error) |
This trigger is checked when a DNS server responds a configured error of type format error, server failure or non-existing domain | error_type | mandatory | IP address,
L7 protocol DNS |
| Global: Connection start (global_new_connection) |
This trigger is checked continuously at the start of each new connection. It can be used to report new connections with a certain layer 4 protocol and a given port range, optionally only after a specific time after the system start. | l4_protocol, port_range, since_start_time | mandatory | Connection filter (src/dst IP and port) |
| Global: GPS synchronization status change (global_gps_sync_status_change) |
This trigger is checked when the GPS clock synchronization status changes. | gps_sync_status | optional | n/a |
| Global: Number of connections (global_connections) |
This trigger is checked continuously whether the amount of newly created connections exceeds a threshold. The update interval is defined by the timespan parameter of the attributes. | new_connections | mandatory | no filter |
| Global: Regular expressions (global_regex_match) |
This trigger allows to configure a list of regular expressions and is checked for each packet whose L7 data matches one of the regular expressions in the list. Since there are no attributes associated with this trigger, this effectively means that any packet which matches one of the regular expressions will result in an incident. The incident also contains information about which connection this packet belongs to as well as which of the regular expressions matches the packet.
The expressions are Perl Compatible Regular Expressions (PCRE) |
no attributes are available for this trigger | Connection filter (src/dst IP and port) | |
| Global: Ring buffer (global_ring_buffer) |
This trigger is checked continuously to report changes in the ring buffer. | used_size, bytes_captured, bytes_dropped | mandatory | n/a |
| Global: Speed change of an interface (global_interface_speed_change) |
This trigger is checked when the speed of an interfaces changes. | interface_speed | optional | n/a |
| Global: Speed mismatch for an interface pair (global_interface_speed_mismatch) |
This trigger is checked when the status or speed of an interfaces changes and mismatches the speed of corresponding interface of a link. | link_speed_difference | optional | n/a |
| Global: Status change of an interface (global_interface_status_change) |
This trigger is checked when the status of an interfaces changes. | interface_status | optional | n/a |
| Global: Traffic (global_traffic) |
This trigger is checked continuously for the total traffic of the device. The update interval is defined by the timespan parameter of the attributes. | throughput, throughput_increase, packet_rate, packet_rate_increase | mandatory | no filter |
| IEC 61850 - GOOSE: State number change (iec61850_goose_state_change) |
This trigger is checked when a change in the state number of GOOSE packets is detected. | GoCBRef | optional | MAC address pair and l7 protocol |
| IEC104: Response times (iec104_response_times) |
This trigger is checked whenever an IEC104 ACTCON reply for an ACT has been seen. | response_time | mandatory | Connection filter (src/dst IP and port) |
| IEC104: Traffic (iec104_traffic) |
This trigger is checked continuously for each IEC104 connection. The update interval is defined by the timespan parameter of the attributes. | percent_loss, absolute_loss, not_in_order | mandatory | Connection filter (src/dst IP and port) |
| IP: Connection end (ip_flow_end) |
This trigger checks the attributes whenever an IP flow ended. | total_packets, total_bytes, tcp_handshake_time, percent_retransmissions, zero_window_packets, duration, l7_protocol, l4_port, l4_client_port, l4_server_port | mandatory | Connection filter (src/dst IP and port) |
| IP: Connection start (ip_flow_start) |
This trigger checks the attributes whenever an IP flow starts. | new_connections, geolocation | mandatory | Connection filter (src/dst IP and port) |
| IP: Local IP with multiple MAC addresses (ip_local_ip_multiple_macs) |
This trigger is checked on each new flow of a local IP address and more than one MAC address uses this IP. | mac_count | optional | IP filter |
| IP: New local IP address (ip_new_local_ip) |
This trigger is checked once for each new IP belonging to a private network address range. | since_start_time | optional | IP filter |
| IP: New L7 protocol (ip_new_l7_protocol) |
This trigger is checked once for each new l7 protocol used by an IP. | since_start_time, local_ip, l7_protocol | optional | IP filter |
| IP: TCP handshake (ip_tcp_handshake) |
This trigger is checked after successful TCP handshake or at connection end if handshake failed. | handshake_time, server_handshake_time, client_handshake_time, handshake_failed, l4_port, l4_server_port, l4_client_port, l7_protocol | mandatory | IP filter |
| IP: Traffic on IP addresses (ip_traffic) |
This trigger is checked continuously for each active IP or IP group. The update interval is defined by the timespan parameter of the attributes. | throughput, throughput_increase, packet_rate, packet_rate_increase, total_packets, total_bytes, retransmission_ratio, zero_window_packets, tcp_syn_packets, tcp_fin_packets, tcp_rst_packets | mandatory | IP or IP group filter |
| IP: TTL change (ip_ttl_change) |
This trigger is checked continuously for each active IP. | ttl_change | mandatory | Connection filter (src/dst IP and port) |
| LACP: Status change of a channel (lacp_channel_status_change) |
This trigger is checked when the status of a LACP port channel changes. | channel_status | optional | l2 filter for LACP protocol |
| MAC: New L7 protocol (mac_new_l7_protocol) |
This trigger is checked when a unicast MAC address uses a l7 protocol for the first time. | since_start_time | optional | MAC filter |
| MAC: New MAC address (mac_new_address) |
This trigger is checked once when a new unicast MAC address appears for the first time. | since_start_time | optional | MAC filter |
| MAC: Traffic on MAC addresses (mac_traffic) |
This trigger is checked continuously for each active MAC address. The update interval is defined by the timespan parameter of the attributes. | broadcast_packet_rate | mandatory | MAC filter |
| PPPoE: PPPoE Discovery traffic (pppoe_discovery_traffic) |
This trigger is checked continuously for PPPoE discovery traffic. The update interval is defined by the timespan parameter of the attributes. | pppoe_discovery_packets | mandatory | l2 filter for PPPoE protocol |
| Profinet: Traffic of Profinet devices (profinet_traffic) |
This trigger is checked continuously for Profinet traffic. For max jitter, the update interval is defined by the timespan parameter of the attributes. All other attributes will be checked upon event. | alarms_low, alarms_high, errors, frames_lost, frames_repeated, frames_wrong_sequence, max_jitter | mandatory | MAC address and
l2 filter for PPPoE protocol |
| PTP: Timestamp packet (ptp_timestamp_packet) |
This trigger is checked when a PTP packet containing a valid timestamp is seen. | time_offset | mandatory | l7 protocol PTP |
| QOS: Traffic on QoS classes (qos_traffic) |
This trigger is checked continuously for each active QoS class. The update interval is defined by the timespan parameter of the attributes. | throughput | mandatory | IP, MPLS, or VLAN QoS filter |
| RTP: Traffic for RTP connections (rtp_traffic) |
This trigger is checked continuously for traffic of each RTP connection. The update interval is defined by the timespan parameter of the attributes. | jitter, percent_loss | mandatory | RTP connection filter |
| SIP: Call end (sip_call_end) |
This trigger is checked when a SIP call ended. | duration, status, mos, percent_loss, jitter, total_packets, total_bytes, total_caller_packets, total_callee_packets, total_caller_bytes, total_callee_bytes | mandatory | SIP IP and call ID plus RTP connection filter |
| SMB: SMB1 negotiation (smb_version_negotiation, prior to 4.3: |
This trigger is executed at the beginning of each SMB connection and checks whether insecure SMB1 has been negotiated (until firmware 4.3). | none | IP pair filter and l7 protocol SMB | |
| SMB: SMB version negotiation (smb_version_negotiation) |
This trigger is executed at the beginning of each SMB connection and checks for a given SMB version (starting with firmware 4.4). | version | mandatory | IP pair filter and l7 protocol SMB |
| TLS: first data packet
(tls_handshake_first_data) |
This trigger is checked when receiving the first data packet of each TLS connection. | tls_first_data_time_ms | mandatory | Connection filter (src/dst IP and port) |
| TLS: Handshake (tls_handshake, prior to 4.4: |
This trigger is checked during handshake of each TLS connection. | certificate_expires
certificate_is_self_signed (firmware > 4.6) tls_alert_level |
mandatory | Connection filter (src/dst IP and port) |
| TLS: TLS Handshake Server Hello
(tls_handshake_server_hello, prior to 4.4: |
This trigger is checked when receiving the Server Hello message of each TLS connection. | used_tls_version, tls_handshake_time_ms | mandatory | Connection filter (src/dst IP and port) |
| WiFi: Handshake failure
(wifi_handshake_failure) |
This trigger is checked during certain parts of a WiFi handshake when a client tries to join a network. | handshake_failure_type | mandatory | n/a |
Special trigger properties
Some triggers are checked continuously every configured time span period, so the incidents are generated differently than for fixed event specific triggers like a call end.
- Repeating incidents: The following triggers will be evaluated every configured time span and will be re-issued whenever the configured attributes match.
- ip_traffic
- mac_traffic
- qos_traffic
- rtp_traffic
- Start/stop incidents: The following triggers are reported once the configured attributes match and for a second time when the attributes no longer match.
- global_traffic
So for repeating incidents you will get repeated incidents for the same attribute every time span. For example, if an IP address has traffic of 100 Mbit/s for 2 minutes and a rule checks for more than 50 Mbit/s over 30 seconds, the rule will hit 4 times. There will be one incident which will contain the exact number of repetitions for reference.
For start/stop incidents, you will only see two rule hits and the incident description will state the start and stop time.
Available attributes
- absolute_loss: Count of lost packets for IEC104 connection.
- alarms_low, alarms_high: Whether an low/high alarm occurred for a Profinet device.
- broadcast_packet_rate: The attribute is the number of packets per second on average over the configured timespan for MAC broadcast packets.
- bytes_captured: The amount of bytes captured by a ring buffer in the given timespan.
- bytes_dropped: The amount of bytes dropped by a ring buffer in the given timespan.
- certificate_expires: This is the number of days until the certificate expires. If the certificate is already expired, the value is <= 0.
- certificate_is_self_signed: If a self-signed certificat is used. The trigger checks whether “Issuer” and “Subject” have the same value. It does not check whether the certificate is signed by a public Certificate Authority. Works only for connections for with TLS <= 1.2
- channel_status: 0 means that the LACP port channel is not synchronized, 1 means that the LACP port channel is synchronized.
- duration:
- IP: Connection end: The time between first and last packet of the flow.
- SIP: Call end: The call duration.
- errors:
- Profinet: Traffic of Profinet devices: Whether errors occured.
- error_type: equal or not equal to:
- Format Error: DNS responds a format error.
- Non-existent Domain: DNS could not find queried domain name.
- Server Failure: DNS responds server failure.
- frames_lost, frames_repeated, frames_wrong_sequence: Whether Profinet frames have been seen with problems in sequence. For loss the count of lost frames is calculated.
- geolocation: checks if a country is part of the connection
- Direction: The direction of traffic
- from: Traffic is coming from the specified country
- to: Traffic is going to the specified country
- any: The specified country is on either side of the connection, or on neither side if the inequality is selected.
- Direction: The direction of traffic
- GoCBRef, The GOOSE control block reference name of the device to filter.
- gps_sync_status: 0 means that the GPS clock in not synchronized, 1 means that the GPS clock is synchronized.
- handshake_failed: Whether TCP handshake failed, i.e. one packet of SYN, SYN-ACK, ACK sequence is missing. If no handshake is seen at all but data (e.g. Allegro was started in the middle of a connection), no incident is generated.
- handshake_failure_type: The type of failure that occured during a WiFi handshake
- Erroneous handshake: The handshake violated the protocol laid out by IEEE802.11. This is not an authentication failure, this is a technical issue with a network device, or an issue with signal strength at the multimeter.
- Failure to authenticate (WPA): A client attempted to join a network but failed to authenticate via WPA2 or WPA3. This indicates a problem during the EAPOL key derivation (most likely invalid credentials).
- Failure to authenticate (WEP): A client attempted to join a network but failed to authenticate via WEP. This indicates a general authentication failure in an authentication frame. More information can be found in the details panel of the offending authentication frame on the handshake details page.
- Failure to (re)associate: A client attempted to join a network, succeeded authentication but ultimately failed to associate with the network. More information can be found in the details panel of the offending (re)association response frame on the handshake details page. Note that association happens after successful WEP authentication, but before WPA authentication.
- handshake_time: The TCP handshake time between the first SYN packet and the ACK packet for the SYN/ACK packet of the server.
- client_handshake_time: The TCP handshake time between the SYN/ACK packet of the server and the ACK packet of the client.
- server_handshake_time: The TCP handshake time between the first SYN packet of the client and the SYN/ACK packet of the server.
- interface_speed: The current speed of the interface in Mbit/s.
- interface_status: 0 means interface is down, 1 means interface is up.
- jitter:
- SIP: Call end: The average jitter of the call, using the maximum value of both call sides.
- RTP: Traffic for RTP connections: The average jitter of the RTP connection for the given timespan, using the maximum value of both directions.
- l4_port: The layer 4 port number, will be compared against both sides of a connection.
- l4_client_port: The layer 4 port number of the client side of a connection.
- l4_server_port: The layer 4 port number of the server side of a connection.
- l4_protocol: The layer 4 protocol. Can be TCP, UDP or other.
- l7_protocol: The layer 7 protocol short name. Can also be a list, e.g. "HTTP, SSH, DHCP"
- local_ip: Whether the IP is local (10/8, 172.16/12, 192.168/16, 169.254/16, fe80::/10, fc00::/7)
- link_speed_difference: This is the absolute difference between the speeds of both interface of a link in Mbit/s.
- mac_count: The number of different MAC addresses for the corresponding IP address.
- max_jitter: The max jitter value for a Profinet device in % in a given timespan.
- mos: The average MOS quality value of the call, using the minimum of both call sides.
- new_connections: The amount of newly created connections (TCP and UDP) for the given timespan.
- not_in_order: Count of not in order packets for IEC104 connection. The sequence number could be too high, too low or repeated.
- packet_rate: The packet rate in packets per second on average during the configured timespan.
- packet_rate_increase: The packet rate increase in % during the configured timespan compared to the average packet rate of the given baseline timespan. The noise can be configured to allow deviations that should not lead to trigger the incident.
- percent_loss:
- SIP: Call end: The percentage of RTP packet loss for the call, accounting packets from both directions.
- RTP: Traffic for RTP connections: The percentage of RTP packet loss for the given timespan, accounting packets from both directions of the RTP connection.
- IEC104: Traffic for IEC104 connections: The percentage of IEC104 packet loss for the given timespan, accounting packets from both directions of the IEC104 connection.
- percent_transmissions: The amount of TCP retransmission as a percentage of the total bytes.
- port_range: The TCP or UDP port. Can be also a range, e.g. 80,443,8443-8445
- pppoe_discovery_packets: The number of PPPoE discovery packets seen during the configured timespan.
- response_time: The response time of IEC104 ACT requests and ACTCON replies.
- retransmission_ratio: The TCP retransmission ratio seen in the configured timespan.
- since_start_time:
- MAC: New L7 protocol: This is the number of seconds after packet processing start when a new Layer-7 protocol for the MAC address appeared.
- MAC: New MAC address: This is the number of seconds after packet processing start when the MAC address appeared. This is useful to only report new MAC address after some learning time.
- IP: New local IP address: This is the number of seconds after packet processing start when the IP address appeared. This is useful to only report new IP address after some learning time.
- IP: New local L7 protocol: This is the number of seconds after packet processing start when the Layer-7 protocol for the IP address appeared.
- Global: Connection start: This is the number of seconds after packet processing start when the connection has been started. This is useful to only report new connections after some learning time.
- status: The call status code (a three digit number, like 200 for Success)
- tcp_handshake_time: The TCP handshake time.
- tcp_fin_packets: The number of TCP FIN packets (RX + TX) seen in the configured timespan.
- tcp_rst_packets: The number of TCP RST packets (RX + TX) seen in the configured timespan.
- tcp_syn_packets: The number of TCP SYN packets (RX + TX) seen in the configured timespan.
- throughput: The throughput bandwidth in bit/s on average during the configured timespan.
- throughput_increase: The throughput bandwidth increase in % during the configured timespan compared to the average throughput of the given baseline timespan. The noise can be configured to allow deviations that should not lead to trigger the incident.
- time_offset: The time offset between the local time and the timestamp seen in the PTP packet.
- time_since_first_unanswered_request: This is the time span between when the trigger is checked and the first DNS request that has not been answered by the DNS server.
- time_since_last_mac: This is the number of seconds between changed MAC addresses. If, for examples, dynamic IP assignment is used, changing MAC addresses is normal so the test can be limited to only a certain amount of time.
- tls_alert_level: The alert level of a TLS alert packet. Can be 'fatal', 'warning' or 'unknown'. A fatal alert will be sent if e.g. TLS handshake failed and connection shall be closed.
- tls_handshake_time_ms: The TLS handshake response time of the TLS handshake.
- tls_handshake_first_data: The TLS data response time of the TLS handshake.
- total_bytes:
- IP: Connection end: The total number of bytes seen for both directions of the flow.
- IP: Traffic on IP addresses, QOS: Traffic on QoS classes, SIP: Call end: The number of bytes seen in the configured timespan.
- total_callee_bytes: The number of bytes seen for the callee of the call.
- total_caller_bytes: The number of bytes seen for the caller of the call.
- total_packets:
- IP: Connection end: The total number of packets seen for both directions of the flow.
- IP: Traffic on IP addresses, QOS: Traffic on QoS classes, SIP: Call end: The number of packets seen in the configured timespan.
- total_callee_packets: The number of packets seen for the callee of the call.
- total_caller_packets: The number of packets seen for the caller of the call.
- ttl_change: Whether TTL or hop limit has changed.
- type: The type of PPPoE discovery packet (PADI, PADO, PADR, PADS, PADT or any).
- used_size: The percentage of the ring buffer that needs to be filled.
- used_tls_version: The TLS version (SSL 3.0, TLS 1.0, TLS 1.1, TLS 1.2 or TLS 1.3)
- version:
- SMB: SMB version negotiation: The SMB version SMB1 or SMB2/3
- window_below_mss: Whether the smallest announced TCP window was below the TCP MSS value. An additional offset is available, to check whether window was smaller than MSS + x bytes.
- zero_window_packets: The number of packets with a TCP window of 0 for both directions of the flow.
- zero_window_packets: The number of zero window packets seen in the configured timespan.
Capture settings
It is possible to automatically capture traffic for occurred incidents. These global settings control where capture files are stored and the capturing itself can be enabled for each rule separately.
The incident capture feature requires an active packet ring buffer since the packets are extracted from the buffer at the end of the incident period.
Available settings:
- Capture cooldown period: For each rule a cooldown period prevents multiple captures from happening in fast succession. By default, new captures happen firstly after 5 seconds, but any other value of at least 1 second can be configured. The cooldown is applied to each rule separately, but for each individual rule it does not matter if the same or a different entity triggers an incident. The incident is still reported within the cooldown period, but no additional capture is started.
- Storage device: Select the storage device where the captures should be stored on.
- Storage directory: Enter the directory where capture files should be stored or leave empty to use the top level directory.
- Select packet ring buffer to capture from: if multiple ring buffer cluster are in use, you can select which ring buffer to use for extraction.
- Capture profile: A capture profile can be configured to apply packet truncation rules to the capture file. If unset, the complete packets are captured (if the ring buffer uses separate truncation rules, truncated packets might still be within the capture file).
Time Profiles
Incident rules can be active configured to be active in configured time spans (time profiles).
Every time profile allows the user to define one or more time spans per day of the week in which a rule should be active. After saving the user is able select the time profile when editing the rule.
Notes: Overlapping time spans will be merged. The earliest a time span is allowed to start is 0 and the latest end is 24, minutes are not allowed. The rule is not active for a day if there is no time span defined for the day.
Channel configuration
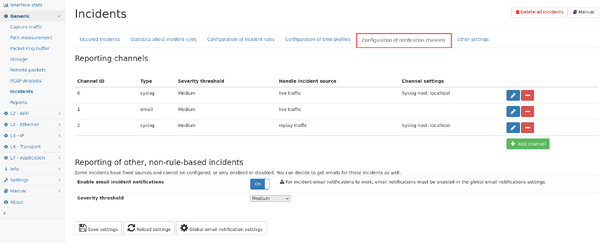
Incidents can be reported on different channels. The configuration allows to add new channels so they can be selected in the rule configuration described above.
Each channel can be of type:
email Incidents will be sent to the email address configured in the Global settings.
kafka The incidents are sent to a topic on the configured Apache Kafka server. The message is the same as for syslog.
- Bootstrap Server: hostname/ip:port of a Kafka Broker or multiple Brokers separated by comma
- Protocol: Plaintext (no authentication, no encryption), SASL Paintext (Plain authentication, no encryption), SASL SSL (Plain authentication, TLS/SSL encryption), mTLS (firmware >= 4.4)
- Ignore TLS Certificate: Ignore the TLS Certificate of the Brokers (only SASL SSL)
- Username: Broker Login (only SASL)
- Password: Broker Login (only SASL)
- Topic: The name of the topic into which the Incidents are sent.
- Partitioner (firmware >= 4.5)
- Random: Choose random partition on Kafka server (default)
- Consistent: Choose partition based on CRC32 hash of the multimeter hostname
snmp_trap Incidents will be sent to the configured SNMP trap receiver. A MIB file with the Allegro Network Multimeter SNMP trap definitions is available for download in the channel configuration dialog.
- Version: Supported SNMP version of the trap receiver (SNMP v2c or SNMP v3)
- Trap receiver (manager) hostname/IP: The trap receiver hostname or IP address
SNMP v2c:
- Community name: SNMP community name expected by the trap receiver
SNMP v3:
- Authentication protocol: Protocol for authenticated messages (MD5, SHA, SHA-224, SHA-256, SHA-384, SHA-512)
- Authentication password: Pass phrase for authenticated messages
- Privacy protocol: Protocol for message encryption (AES, DES)
- Privacy password: Pass phrase for message encryption
- Security name: Security name for authenticated SNMP messages
- Security level: Security level for SNMP messages (noAuthNoPriv, authNoPriv, authPriv)
- Engine ID: Authoritative (security) engineID (hexadecimal number of an even amount of 10 to 64 hexadecimal digits, optionally prefixed with "0x")
syslog Incidents will be sent to the configured syslog server via UDP, TCP and TLS (firmware >= 4.6) port.
Each channel also uses a minimum severity setting, so only incidents are reported which are of at least that severity.
Each channel can be configured to only handle incidents from live traffic or from replayed traffic.
Some incidents cannot be configured via rules and you can choose to get those incidents also via email by enabling the settings at the lower part of the settings page.
After saving the configuration, a test message can be sent to the target system.
Other settings
Interface burst incident
Burst incidents with milli-second resolution can be generated when the interface throughput exceeds a configurable threshold. The incident contains a graph of traffic for that interface with some data points before and after the threshold has been exceeded depending on the measurement interval. A PCAP link for capturing from the packet ring buffer is shown. For further investigation of that incident, the button "Use as global time range" can be used to set the global range to the start and end of the incident graph (at least 5 seconds) so that all modules of the Allegro Network Multimeter show that time span.
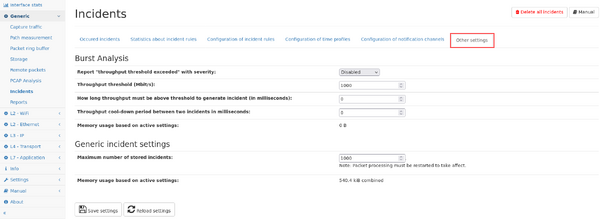
The incident generation can be configured in the "Other settings" tab as follows:
- Report "throughput threshold exceeded" with severity: report an incident with the selected severity level if the throughput of any network interface exceeded.
- Throughput threshold (Mbit/s): The threshold is configured in Mbit/s.
- How long throughput must be above threshold to generate incident (in milliseconds): The throughput must exceed the threshold for this duration in order to generate the incident. If set to zero (default) the incident is generated immediately after the threshold has been exceeded.
- Throughput cool-down period between two incidents in milliseconds: Defines the time after an incident where no new incident is generated even if the threshold is exceeded. If this period is passed, throughput incidents could be generated again.
Since each burst incidents stores the high resolution traffic graph, this feature uses a significant amount of memory. The actual amount is shown below and also depends on the maximum number of incidents configured in the section below.
Generic incident settings
This section allows to modify generic settings regarding the incident feature:
- Maximum number of stored incidents: This value defines how many incidents are stored before old incidents are removed. Increasing this value also increased the amount of memory reserved for this feature.
The corresponding value for the active setting is shown below, changing the configuration value requires a restart of the packet processing to take affect.
Occured incidents
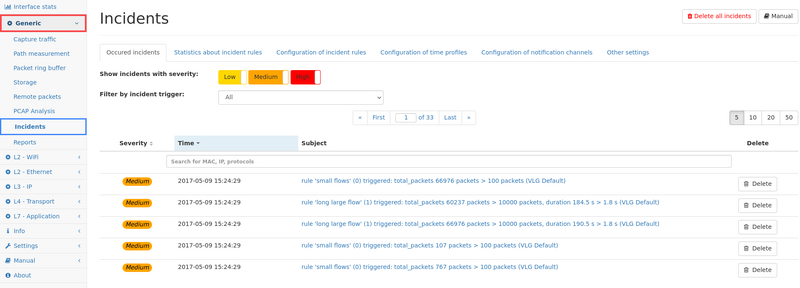
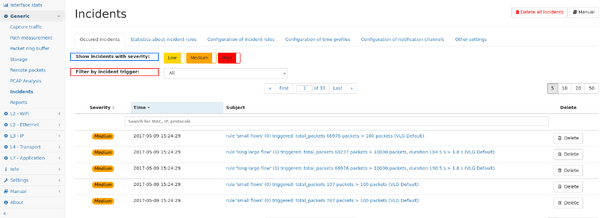
This page shows up to the last incidents occurred on the system. The table can be filtered for specific severity levels, as well as for specific trigger sources by selecting the trigger from the drop down menu.
The list can also be filtered for the subject of the incident.
Individual incidents can be viewed in detail by clicking on the subject. The details page shows detailed information including links to the relevant measurement page.
Incidents can be deleted individually by clicking on the delete button next to the incident, or all incidents can be deleted by clicking on the button on the top right of the page.
The number of incidents available in this view is limited by a configurable number (firmware <4.1 was limited to 1000), the configuration as available in the "Other settings" tab.
Incident statistics
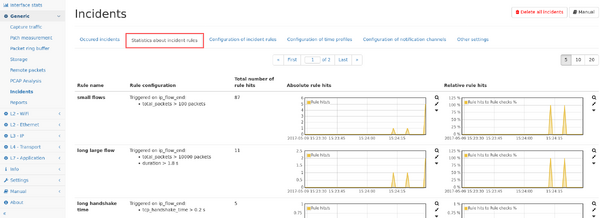
This page shows graphs about how often each rule has been hit both in absolute numbers as well as relatively to how often the rule has been checked.
Incident list per measurement modules
Since incidents are triggered by different measurement modules (as indicate by the prefix of the trigger name, like the mac or ip module), the list of incidents from that specific module can also be seen in the corresponding tab of the measurement module for quicker access. This per-module view only lists those incidents coming from that module, all other potential incidents are hidden and must be accessed in their corresponding module page, or in the global view in the "Generic -> Incident" menu.
Limitations
Some technical limitations apply:
- continuously checked triggers like "IP traffic" are only evaluated if there was at least one packet in the corresponding time interval. Therefore, rules check for zero packet count or throughput will never match.
