TCP module
The TCP module measures the time taken to receive the first response to a TCP connection setup packet. This time is influenced by the network round-trip time and the load of the server to be able to respond to a connection request. A score value is calculated based on a scoring algorithm.
TCP Statistics
Section titled “TCP Statistics”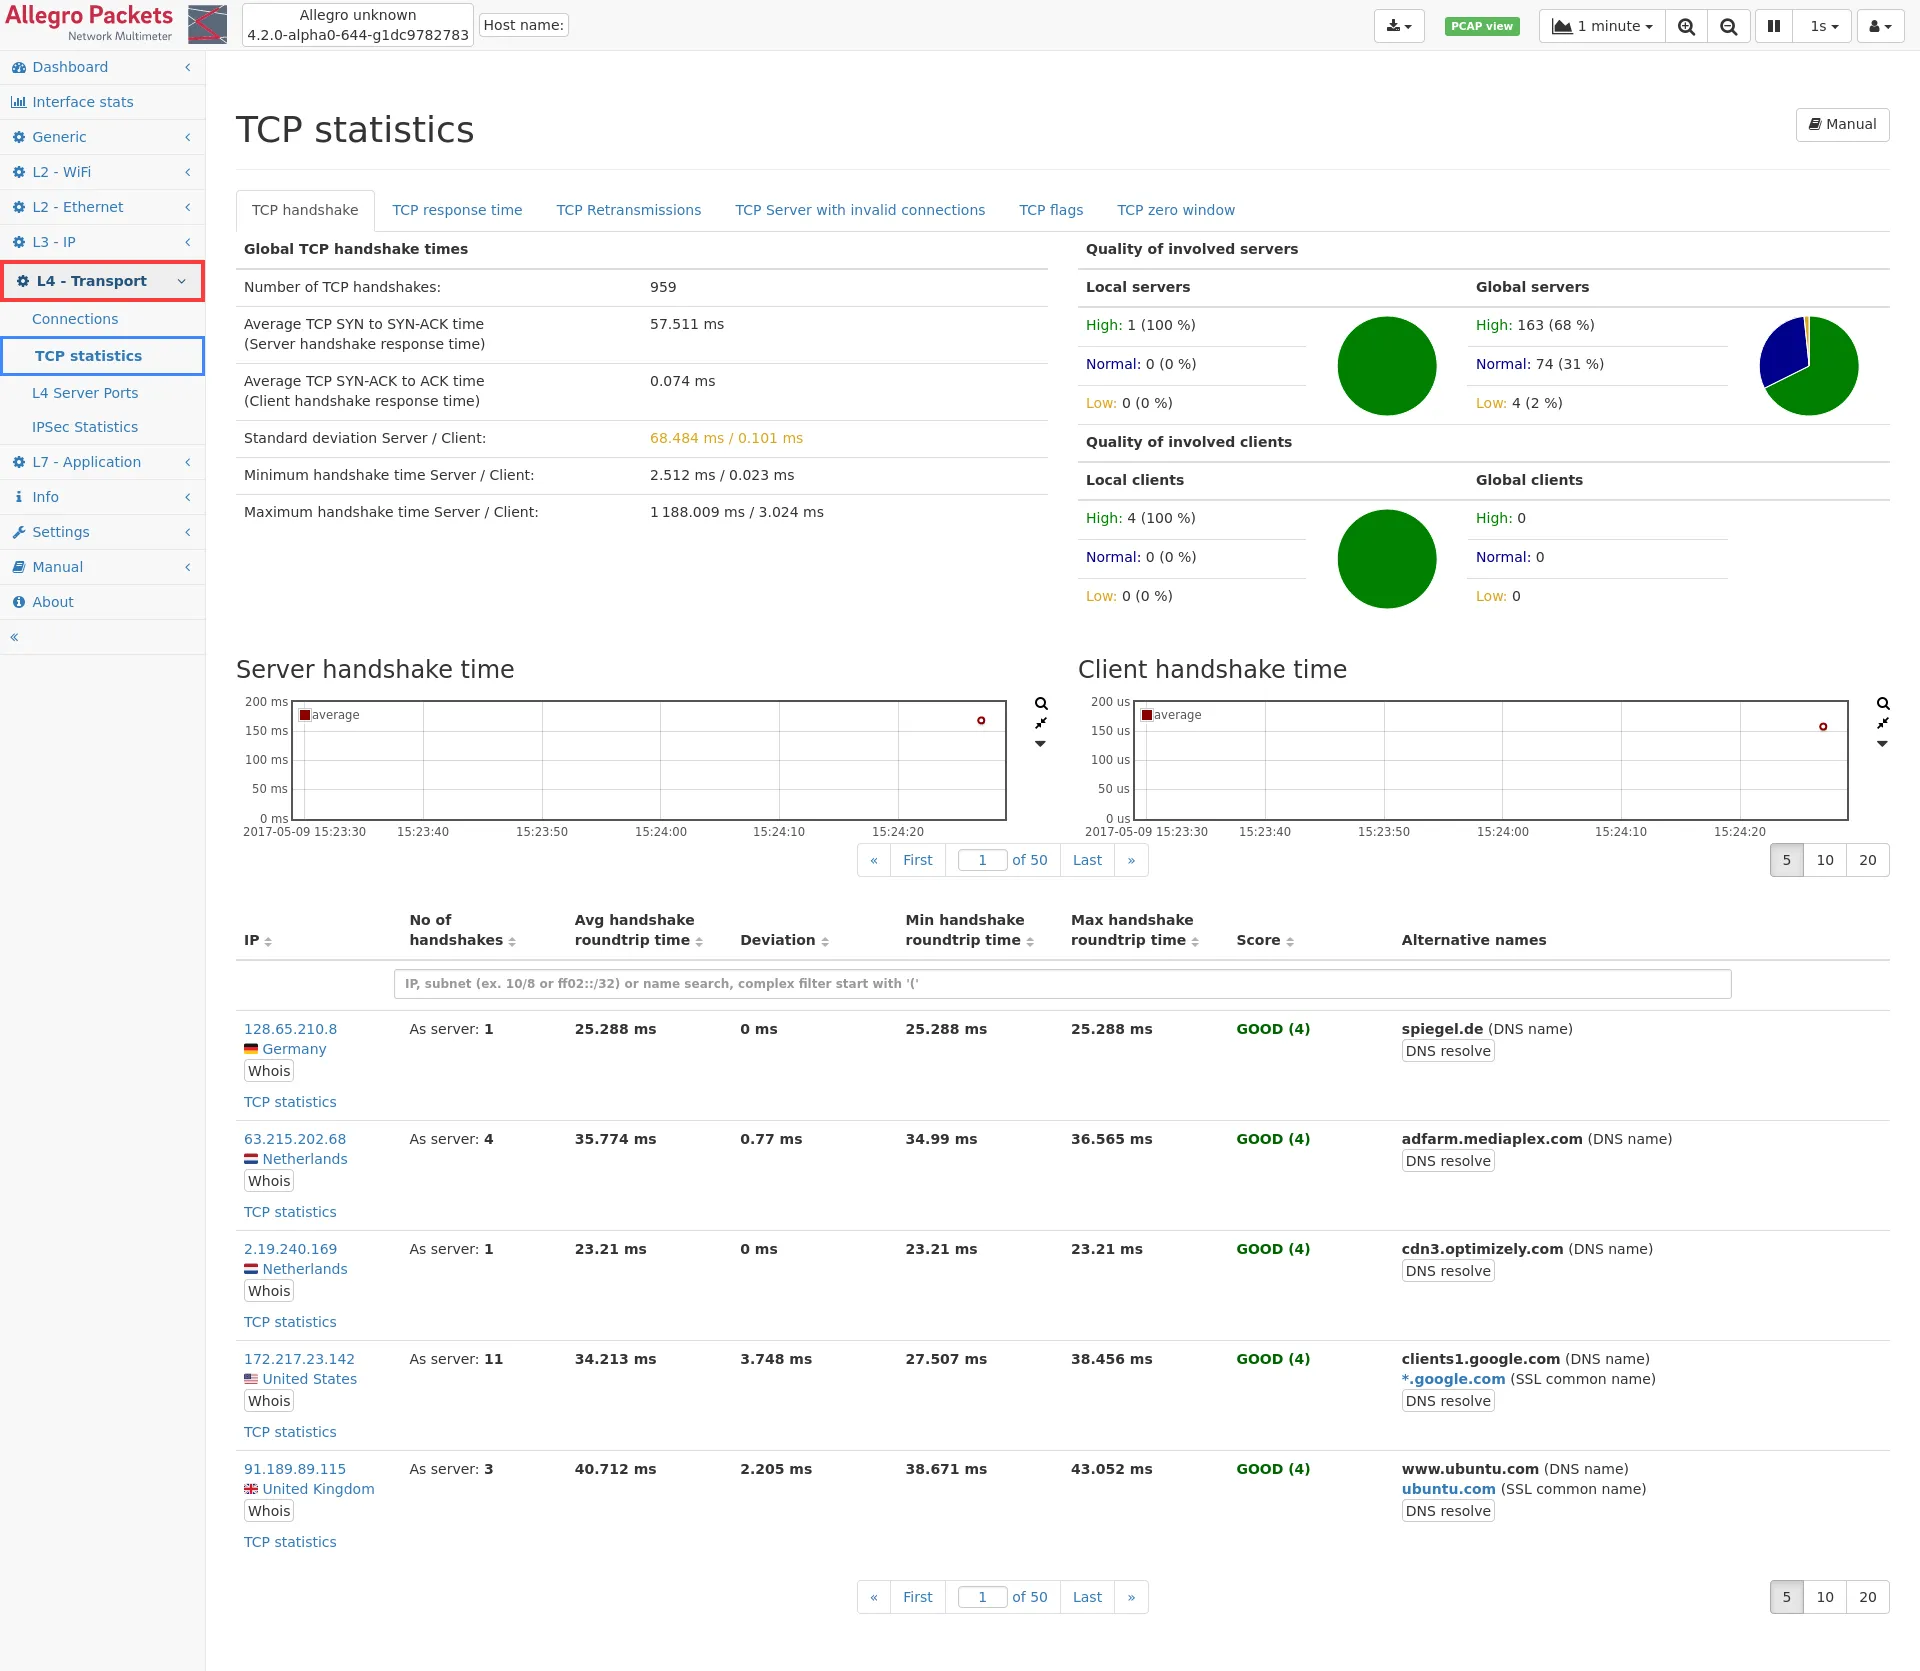
TCP handshake
Section titled “TCP handshake”This web page of the TCP module shows global statistics about the response time of TCP connection handshakes of all TCP connections and a list of all servers for which response times could be calculated.
The global statistics contains:
- Number of TCP handshakes: This is the total number of TCP connections for which the handshake has been seen. It may be less than the number of all connections if connections have been established before the system has been started.
- Average handshake time: This is the average time between first TCP SYN packet and its response in milliseconds for all servers.
- Standard deviation: This value shows the variation of the handshake times (en.wikipedia.org/wiki/Standard_deviation).
- Minimum handshake time: This is the smallest handshake time seen on the network.
- Maximum handshake time: This is the largest handshake time seen on the network.
Next to the global statistics, there is a summary about the number of servers with high, normal or low handshake quality. The table is split to local servers (those within private networks) and global servers (all the rest). The green high quality section contains all servers with a quality score of 4 or more, the blue normal section covers all servers with a quality score between 3 and 4, and the orange low section covers all servers with a quality score of less than 3. The list of servers below can be sorted for the quality value to view the relevant servers from each category. Below the global statistics, there are up to two graphs showing the historical data for TCP handshakes. Each data point shows the average handshake time for the time span (depending on the zoom factor), and the min and max time. One graph is for handshake times for the server (that is the time between the first SYN packet and the server response) and the second graph shows the data for the client time (that is the time between the server response packet and the client acknowledgment).
Below the graph there is the list of all servers with the following columns:
- IP (see Common table columns - IP): The server IP. Clicking on TCP statistics leads to the IP module subpage listing all TCP connections.
- No of handshakes: The number of TCP requests/responses seen for this IP address.
- Avg handshake roundtrip time: This is the average handshake time for this IP address.
- Deviation: This is the standard deviation for all handshake times of this IP address.
- Min handshake roundtrip time: The minimum handshake time in milliseconds.
- Max handshake roundtrip time: The maximum handshake time in milliseconds.
- Score: The score is a value between 1 and 5 describing the quality of the TCP handshake times. 1 means the worst quality, 5 means the best quality. The value is calculated based on a scoring algorithm. The score allows to quickly sort for quality and identify bad performing servers or servers with high round-trip time.
- Alternative names: The column contains other names for this IP address, from whatever name source that is available (DNS, DHCP, …).
Per IP statistics
Section titled “Per IP statistics”It is possible to select an IP from the list of IP addresses and get a more detailed view of the information stored about that IP. The link leads to the TCP statistics page of that specific IP. Additional information can be found in the IP module.
TCP response time
Section titled “TCP response time”This tab shows the continuous measurement of TCP response times. The time measured is the interval between a transfer of data and the respective acknowledgement.
The graph on the top shows a minimum, maximum and average response time over all TCP connections observed.
The IP list below shows the minimum, maximum and average response time for each IP address.
TCP application time
Section titled “TCP application time”The application time measures the time of TCP transactions, that is consecutive data packets sent by the client, followed by a server response of consecutive data packets.
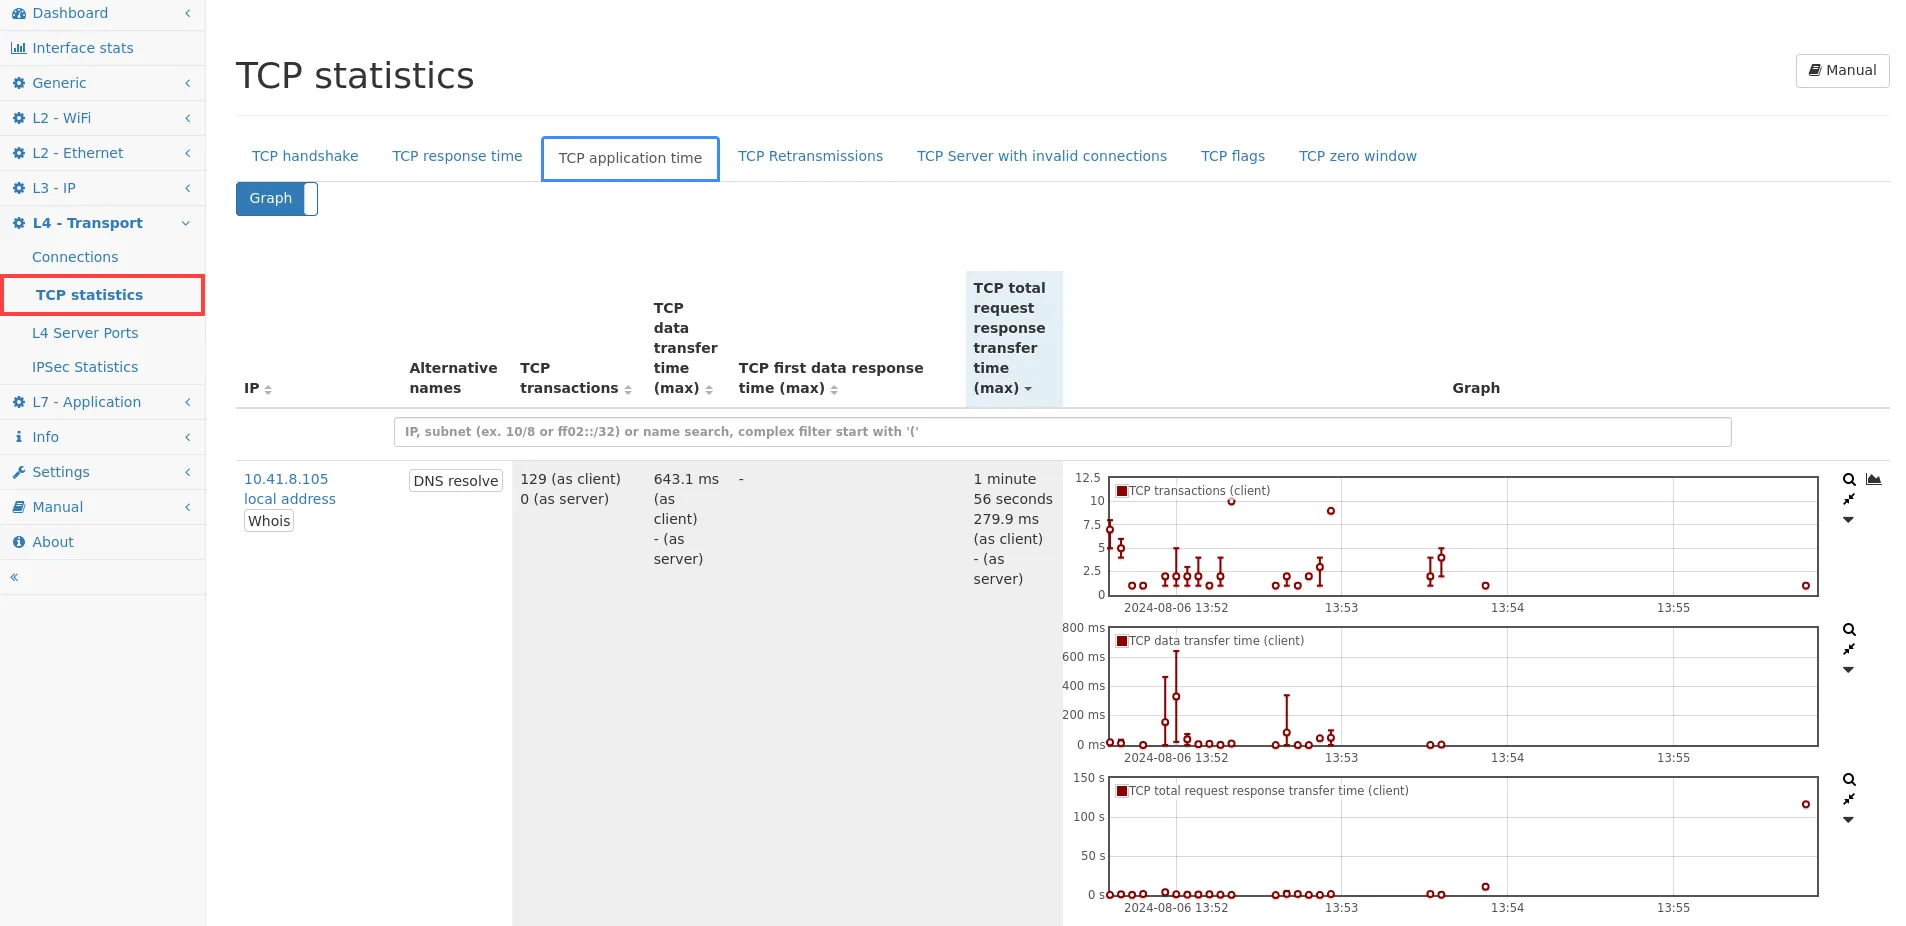
TCP application time
See TCP application time for more details about the measured values.
TCP retransmissions
Section titled “TCP retransmissions”This tab shows all IP addresses with TCP traffic and the aggregated amount of TCP payload sent and received and the amount of data that needed to be retransmitted due to packet loss.
Garbage bytes
Section titled “Garbage bytes”Garbage bytes are single bytes sent as part of TCP keep alive packets that have already been acknowledged before by the receiver of the data. Some TCP implementations send single bytes as keep alive packets instead of just empty ACK packets. The retransmitted byte has already been acknowledged and may be the same or different as the original byte of the same sequence number. The TCP stack of the receiver will discard this byte. Technically it is a retransmitted byte, but since it is already acknowledged and will be discarded, we account this byte as a garbage byte to not show as part of regular retransmissions.
Missed data
Section titled “Missed data”Additionally to retransmission data, there is also a graph for the number of bytes not seen by the Allegro Network Multimeter. This can happen if for example a mirror/SPAN port is incapable of sending all packets to the Allegro. So the data was actually sent over the network, but only part of it was sent to the Allegro Network Multimeter for analysis. In WireShark, such “missed data” events will be displayed with the additional protocol information [TCP ACKed unseen segment].
Example:
If there is a transfer of 500 Mbit/s going in the network but the mirror port only outputs 100 Mbit/s, the Allegro Network Multimeter of course can only account those 100 Mbit/s. But based on the TCP sequence numbers, we can estimate that the remaining 400 Mbit/s has been missed. This portion is visible in the missed data graph.
Usually one can expect to see no missed data at all, especially in inline mode, but it can still happen that there is a small amount of bytes not seen due to multiple reason. One reason is corrupt data where TCP sequence numbers are wrong on purpose. There can also be situations where TCP packets are not seen but actually sent, for example, if they are dropped in some other network component.
TCP server with invalid connections
Section titled “TCP server with invalid connections”Here a list of all servers with invalid connections is shown. Connections are counted as invalid if the handshake fails or no data is transferred at all.
Each line shows the number of Invalid connections and the number of Valid connections for a certain TCP server.
The Invalid connection factor is the ratio of invalid connections vs valid connection (invalid/(valid+1)). A higher value means more invalid connections and therefore indicates problematic IPs.
TCP flags
Section titled “TCP flags”This tab shows the occurrence of certain TCP flags. Packets with the following flags are counted:
- TCP SYNs: TCP packets where the SYN flag is set but not the ACK flag.
- TCP SYN-ACKs: TCP packets where the SYN flag and the ACK flag is set.
- TCP FINs: TCP packets where the FIN flag is set.
- TCP RSTs: TCP packets where the RST flag is set.
A graph shows the number of packets for each tracked flag type over time. The IP list below the graph shows the number of sent and received TCP packets for each tracked flag type per IP.
TCP zero window
Section titled “TCP zero window”This tab shows the occurrence of TCP packets that signal a window size of zero. This usually means that the TCP receive buffer of the system sending the zero window packet is filled up and the system cannot receive any more data for that connection. A graph shows the global number of TCP zero window packets over time. The IP list below the graph shows the number of sent and received TCP zero window packets for each IP.
Configuration settings
Section titled “Configuration settings”The TCP connection information rely on the IP module to store connections for each IP address. This feature takes significant amount of memory and can be disabled in the IP module configuration.