Incidents
<accesscontrol></accesscontrol>
Incidents are just to alarm the user when configured events appear, usually for traffic based rules, but also for system-specific events.
The incident feature allows to define rules which are checked on the configured trigger point, like when a connection ends, a SIP call ends, or for checks on ongoing traffic. When such a trigger hits, configurable traffic attributes will be checked and if all attributes of a rule matches, an incident is created.
Occurred incidents can be seen in the web interface, and additionally reporting via email or syslog is possible too.
1. Rule configuration
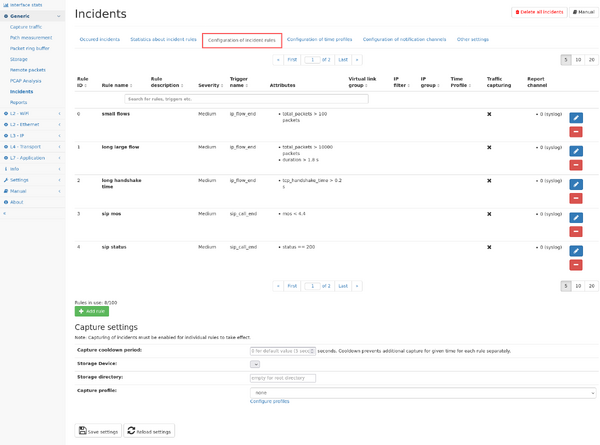
Incident rules can be defined in the "Configuration of incident rules" tab in the menu "Generic -> Incidents". All changes to the rule configuration will only take affect after saving the current configuration by clicking on the save button at the bottom of the page.
The page shows a table containing the existing rules and their configuration.
Each existing rule can be modified by clicking on the pencil symbol, or deleted by clicking on the "minus" symbol.
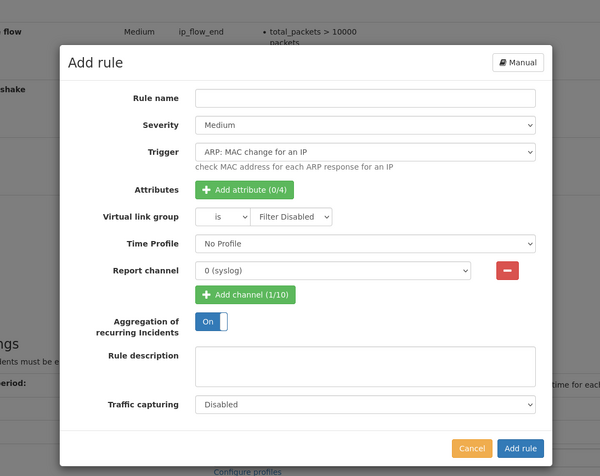
New rules can be added by clicking on the "Add rule" button. A dialog appears allowing for configuration of the rule. The same dialog is used when modifying an existing rule.
1.1. Add/modify a rule
A rule is defined by the following settings:
- Rule text: This is an arbitrary text describing the purpose of the rule. This text is shown in the incident list and email/syslog ouptut.
- Severity: three different severity values "low", "medium", and "high" can be used to group more important and less important incidents. Reporting channels can be configured to only report incidents of a minimum severity level. A rule can also be disabled by choosing the severity level "disabled". It will not be evaluated and can be enabled later at will.
- Trigger: The trigger defines when a rule is evaluated. For each available trigger, a description is shown next to it giving more details about the trigger. Some triggers are evaluated at a very specific time, like when a VoIP call ends, or are evaluated regularly like for throughput triggers of IP traffic which can be configured to be checked once very minute or hour or so. See list below for a detailed description of the available triggers.
- Attributes: Attributes are used to make actual comparison of expected values vs. actual values.
- Each trigger has a different set of attributes which can be checked for, and some triggers don't need to have an attribute at all. See list below for a detailed description of the available attributes
- Up to four attributes can be added by clicking on the "Add attribute" button.
- Multiple attributes must all match at the same time to let the rule create an incident.
- Each attribute can be compared to a specific value, so that the actual value is lower, equal, or greater than a defined value.
- Some attributes have an additional parameter, like a timespan which defines how the attribute value is calculated.
- Virtual link group: The rule can be limited to a selected virtual link group or to be applied for any group. Some triggers cannot be limited to a virtual link group so the configuration will be hidden.
- IP filter: Depending on the selected trigger, the rule can be limited to a specific IP address.
- IP group: Depending on the selected trigger, the rule can be apply to IP group instead of individual IP address.
- Report channel: Incidents are always visible in the web interface, but can also be reported via multiple channels which can be configured separately in the tab "Configuration of notification channels". Up to ten channels can be selected so that the incident for this rule is reported on each channel. Also, no channel can be configured so the incident is only accessible on the web interface.
1.2. Available triggers
| Trigger name | Description | Attribute usage |
|---|---|---|
| mac_traffic | This trigger is checked continuously for each active MAC address. The update interval is defined by the timespan parameter of the attributes. | mandatory |
| mac_new_address | This trigger is checked once when a new MAC address appears for the first time. | optional |
| mac_new_l7_protocol | This trigger is checked when a MAC address uses a l7 protocol for the first time. | optional |
| arp_ip_mac_changed | This trigger is checked on an ARP response and MAC address changed for a requested IP. | optional |
| ip_flow_end | This trigger checks the attributes whenever an IP flow ended. | mandatory |
| ip_traffic | This trigger is checked continuously for each active IP or IP group. The update interval is defined by the timespan parameter of the attributes. | mandatory |
| ip_new_local_ip | This trigger is checked once for each new local IP. | optional |
| ip_new_local_l7_protocol | This trigger is checked once for each new l7 protocol used by a local IP. | optional |
| ip_local_ip_multiple_macs | This trigger is checked on each new flow of a local IP address and more than one MAC address uses this IP. | optional |
| ip_tcp_handshake | This trigger is checked after successful TCP handshake. | mandatory |
| qos_traffic | This trigger is checked continuously for each active QoS class. The update interval is defined by the timespan parameter of the attributes. | mandatory |
| dns_server_not_responding | This trigger is checked when a DNS server is not responding for some time. | optional |
| sip_call_end | This trigger is checked when a SIP call ended. | mandatory |
| global_interface_status_change | This trigger is checked when the status of an interfaces changes. | optional |
| global_interface_speed_change | This trigger is checked when the speed of an interfaces changes. | optional |
| global_interface_speed_mismatch | This trigger is checked when the status or speed of an interfaces changes and mismatches the speed of corresponding interface of a link. | optional |
| global_traffic | This trigger is checked continuously for the total traffic of the device. The update interval is defined by the timespan parameter of the attributes. | mandatory |
1.3. Available attributes
- mac_traffic
- broadcast_packet_rate: The attribute is the number of packets per second on average over the configured timespan for MAC broadcast packets.
- mac_new_address
- since_start_time: This is number of seconds after packet processing start when the MAC address appeared. This is useful to only report new MAC address after some learning time.
- mac_new_l7_protocol
- since_start_time: This is number of seconds after packet processing start when the MAC address appeared. This is useful to only report new MAC address after some learning time.
- arp_ip_mac_changed
- time_since_last_mac: This is number of seconds between changed MAC addresses. If, for examples, dynamic IP assignment is used, changing MAC addresses is normal so the test can be limited to only a certain amount of time.
- ip_flow_end
- total_packets: The total number of packets seen for both directions of the flow.
- total_bytes: The total number of bytes seen for both directions of the flow.
- tcp_handshake_time: The TCP handshake time.
- percent_transmissions: The amount of TCP retransmission as a percentage of the total bytes.
- duration: The time between first and last packet of the flow.
- ip_traffic
- throughput: The throughput bandwidth in bit/s on average during the configured timespan.
- total_packets: The number of packets seen in the configured timespan.
- total_bytes: The number of bytes seen in the configured timespan.
- retransmission_ratio: The number of zero window packets seen in the configured timespan.
- zero_window_packets: The number of zero window packets seen in the configured timespan.
- ip_new_local_ip
- since_start_time: This is number of seconds after packet processing start when the MAC address appeared. This is useful to only report new MAC address after some learning time.
- ip_new_local_l7_protocol
- since_start_time: This is number of seconds after packet processing start when the MAC address appeared. This is useful to only report new MAC address after some learning time.
- ip_local_ip_multiple_macs
- mac_count: The number of different MAC address for the corresponding IP address.
- ip_tcp_handshake
- handshake_time: The TCP handshake time between the first SYN packet the ACK packet for the SYN/ACK packet of the server.
- qos_traffic
- throughput: The throughput bandwidth in bit/s on average during the configured timespan.
- total_packets: The number of packets seen in the configured timespan.
- total_bytes: The number of bytes seen in the configured timespan.
- dns_server_not_responding
- time_since_first_unanswered_request: This is the time span between when the trigger is checked and the first DNS request that has not been answered by the DNS server.
- sip_call_end
- duration: The call duration.
- status: The call status code (a three digit number, like 200 for Success)
- mos: The average MOS quality value of the call, using the minimum of both call sides.
- percent_loss: The percentage of RTP packet loss for the call, accounting packets from both directions.
- jitter: The average jitter of the call, using the maximum value of both call sides.
- total_packets: The number of packets seen in the configured timespan.
- total_bytes: The number of bytes seen in the configured timespan.
- global_interface_status_change
- interface_status: 0 means interface is down, 1 means interface is up.
- global_interface_speed_change
- interface_speed: The current speed of the interface in mbit/s.
- global_interface_speed_mismatch
- link_speed_difference: This is the absolute difference between the speeds of both interface of a link in mbit/s.
- global_traffic
- throughput: The throughput bandwidth in bit/s on average during the configured timespan.
- packet_rate: The packet packets/s on average during the configured timespan.
2. Channel configuration
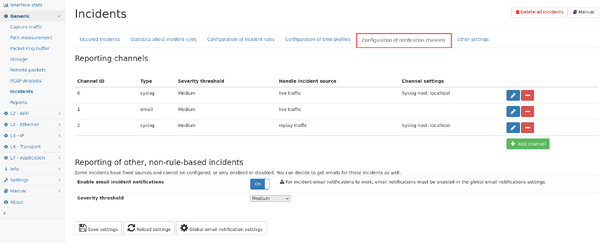
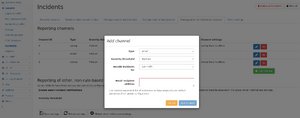
Incidents can be reported on different channels. The configuration allows to add new channels so they can be selected in the rule configuration described above.
Each channel can be of type:
- email: Incidents will be sent to the email address configured in the Global settings.
- syslog: Incidents will be sent to the configured syslog server via TCP on port 514.
Each channel also uses a minimum severity settings so only incidents are reported which are of at least that severity.
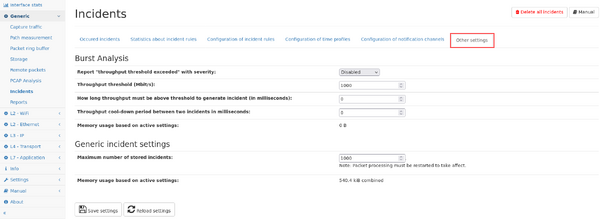
Some incidents cannot be configured via rules and you can choose to get those incidents also via email by enabling the settings at the lower part of the settings page.
3. Other incidents settings
Incidents that cannot be configured separately via rules can be configured on this page.
4. Occured incident view
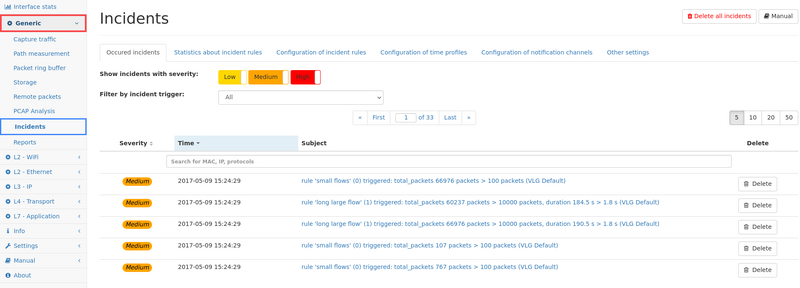
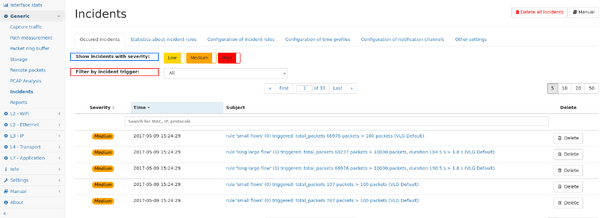
This page shows up to the last 1000 incidents occurred on the system. The table can be filtered for specific severity levels, as well as for specific trigger sources by selecting the trigger from the drop down menu.
The list can also be filtered for the subject of the incident.
Individual incidents can be view in detail by clicking on the subject. The details page shows detailed information including links to the relevant measurement page.
Incidents can be deleted individually by clicking on the delete button next to the incident, or all incident can be deleted by clicking on the button on the top right of the page.
5. Rule statistics
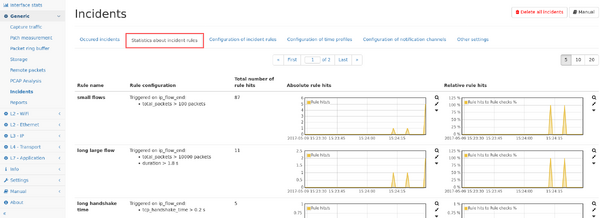
This page shows graphs about how often each rule has been hit both in absolute numbers as well as relatively to how often the rule has been checked.
6. Incident list per measurement modules
Since incidents are triggered by different measurement modules (as indicate by the prefix of the trigger name, like the mac or ip module), the list of incidents from that specific module can also be seen in the corresponding tab of the measurement module for quicker access. This per-module view only lists those incidents coming from that module, all other potential incidents are hidden and must be accessed in their corresponding module page, or in the global view in the "Generic -> Incident" menu.
