Info Menu
System Info
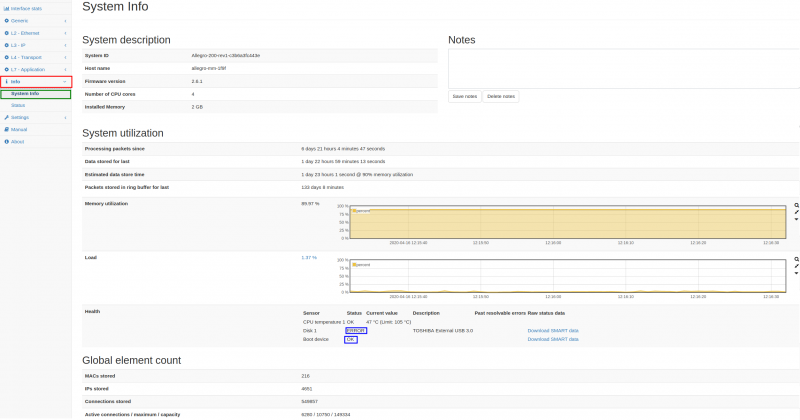
This page contains multiple sections about different parameters of the system. The System description describes system parameters such as the Firmware version and the installed CPU cores and memory. There is also a 'Notes' text box which can be used to save some system-specific notes and optionally show them after logging in (displayed in a modal dialog after login). These notes are also visible on the 'Global traffic' dashboard when the system is used as a remote multimeter from another device. The System utilization summarizes statistics about the current utilization which is dependent on the actual network traffic.
- Processing packets since: This is the time since the packet processing was started. This can be the uptime of the system but packet processing can be manually restarted for various reasons (replaying pcap files, clearing all data, changing some configuration settings, etc).
- Statistics accessible for the last/Data stored for last: This value describes how long the Allegro Network Multimeter contains information from historical traffic.
- The storage duration depends on the network traffic, the configuration settings, and the amount of memory available in the system.
- Once the memory is fully utilized, older data will be automatically removed in favor of new data.
- Estimated data store time: This value is calculated based on the current data store time and the memory utilization. It gives an indication for how long data can be stored once the memory is fully in use (which is automatically adjusted to 90%). (With 3.7 this will be called "Maximum time statistics could be accessible")
- Packets stored in ring buffer for last: If a storage device is used for a packet ring buffer, this time indicates how long packet data has been stored in the buffer.
- This means that network traffic can be extracted from the past within this time period.
- The duration may be larger than the data store time or even shorter depending on the actual network traffic and the size of the storage device and ring buffer.
- Memory utilization: The current utilization is printed together with a graph about the change of the utilization over time.
- The Allegro Network Multimeter uses an automatic cleanup mechanism to remove old data in favor of new data.
- The available memory should always be used as much as possible and the cleanup mechanism ensures that approximately 90% of the system memory is in use. (With 3.7 this will be called "In Memory DB utilization")
- Load: The load information shows the utilization of the system’s CPU.
- If the load hits 100% for a longer period of time, it means the system is overloaded for the current network traffic.
- A corresponding notification is shown at the top of the window.
- When this happens, usually some network traffic can no longer be analyzed and packet drops occur.
- This only affects packet analysis. In Bridge mode, packet forwarding is still possible even if the analysis is overloaded.
- Ingress packet memory utilization: Shows the usage of the memory reserved for buffering received packets.
- The current utilization is printed together with a graph about the change of the utilization over time.
- If this memory is depleted some packets will not be processed.
- See Global settings for the configuration of the Ingress packet memory size.
- The Global element count lists some global parameters about how many MAC addresses, IP addresses, connections and so on are stored in the system.
- If the system is equipped with a GPS precision option, the section GPS information shows information about the clock synchronization, accuracy, and so on.
Status
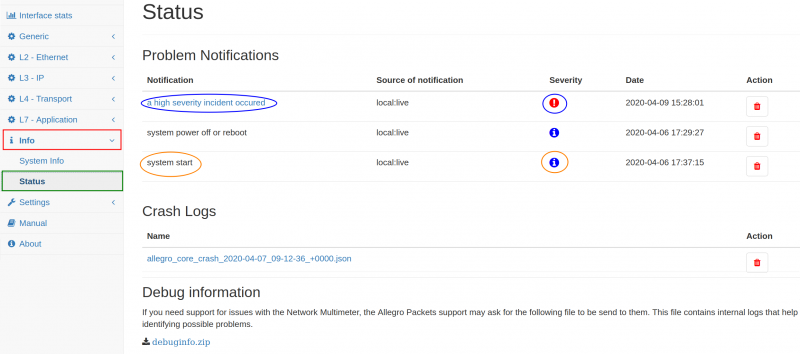
The Status page lists possible problems occurred during packet processing. This includes bypassed packets in case of system overload, core restarts, and other problems. In case of crashes, crash logs are shown which can be downloaded and send to our support to be able to identify problems.
System events
System events are generated by the system manager or middleware unrelated to actual network traffic analysis. See System events for details.

