Performance Optimization Guide: Difference between revisions
No edit summary |
|||
| Line 3: | Line 3: | ||
== About == | == About == | ||
This guide is about performance optimization of the Allegro for specific use cases. By default, the | This guide is about performance optimization of the '''Allegro Network Multimeter''' for specific use cases. By default, the device runs in a configuration that fits for the majority of users and you do not need to change any parameter of the configuration. Depending on the actual network traffic and measurement setup, it can be beneficial to adjust some performance-related parameters to achieve better overall performance. | ||
== High Level Allegro System Layout == | == High Level Allegro System Layout == | ||
The Allegro has various | The '''Allegro Network Multimeter''' has various components that processes the traffic. These components are: | ||
* I/O threads: responsible for all I/O operations between the | * I/O threads: responsible for all I/O operations between the network interface cards and the CPUs. | ||
* Analyzer threads: responsible for decoding and most of the database operations | * Analyzer threads: responsible for decoding network traffic and most of the database operations for the statistical values. | ||
* DB threads: optional threads | * DB threads: optional threads which offload memory intensive database operations, see [[DB mode]]. | ||
The Allegro uses queues to buffer packets and messages between the hardware instances ( interfaces chips, central processing unit, storage ) and threads. All threads measure their which | The '''Allegro Network Multimeter''' uses queues to buffer packets and messages between the hardware instances (interfaces chips, central processing unit, storage) and threads. All threads measure their load individually which can be monitored at '''Info''' → '''System Info''' → '''Load'''. | ||
The following queues can be monitored to see where | The utilization of the following queues can be monitored to see if and where changes to queue settings are helpful: | ||
== Interface hardware queues == | == Interface hardware queues == | ||
The interface hardware queue is between the interfaces and I/O threads of the central processing unit. Whenever the I/O threads are too slow to consume all packets from the built-in or extension interfaces, the '''hardware miss''' counter of the | The interface hardware queue is between the network interfaces and the I/O threads of the central processing unit. Whenever the I/O threads are too slow to consume all packets from the built-in or extension network interfaces, the '''hardware miss''' counter of the [[Interface statistics]] will increase over time. | ||
The load of the I/O threads can be checked at the '''Info''' → '''System Info''' → '''Load'''. | The load of the I/O threads can be checked at the '''Info''' → '''System Info''' → '''Load'''. | ||
| Line 25: | Line 25: | ||
TODO: add overloaded Interface graph. | TODO: add overloaded Interface graph. | ||
If | If the load is near 100%, packet miss can occur and the following countermeasures can be tried: | ||
The bridge mode requires approximately 10 - 30 % more load on the I/O | # The bridge mode requires approximately 10% - 30% more load on the I/O threads than the sink mode. The I/O threads have to sent the incoming traffic to the corresponding outgoing network interface for forwarding. If packet forwarding is not necessary (for example when being deployed at a mirror port), switching to '''sink mode''' will improve the performance of the device. For configuration, please see [[Global_settings#Packet_processing_mode|Global settings]]. | ||
For configuration, please see | # The number of I/O threads can be adjusted at the cost of analyzer threads. This option is available on the Allegro 3000 and above due to the large number of internal CPU cores. Allegro Packets recommends to increase the analyzer threads only on the Allegro 3000 and above if necessary. | ||
#: This setting can be changed at '''Settings''' -> '''Global Settings''' → '''Expert Settings''' | |||
The number of I/O threads can be | #: [[File:Rx sockets io thread.png|600px]] | ||
#: Allegro Packets recommends to test with HT enabled and 2 or 4 threads for I/O. If you disable the load on the analyzers ( see [[#High analyzer load]] ), you can also test with 4 I/O Threads without HT for maximum performance. | |||
This setting can be changed at '''Settings''' -> '''Global Settings''' → '''Expert Settings''' | |||
[[File:Rx sockets io thread.png|600px]] | |||
Allegro recommends to test with HT enabled and 2 or 4 threads for I/O. If you disable the load on the analyzers ( see [[#High analyzer load]] ), you can also test with 4 I/O Threads without HT for maximum performance. | |||
== Analyzer queues == | == Analyzer queues == | ||
The Allegro has a packet queue between I/O threads and the analyzer threads. Please note that the increasing counters at the initial startup of the Allegro can be normal under high load scenarios for a few seconds. You can check at the '''Interface stats''' per interface all I/O threads could push all packets to the analyzer queues or not. The counter is '''Not processed due to overload'''. | The '''Allegro Network Multimeter''' has a packet queue between I/O threads and the analyzer threads. Please note that the increasing counters at the initial startup of the Allegro can be normal under high load scenarios for a few seconds. You can check at the '''Interface stats''' per interface all I/O threads could push all packets to the analyzer queues or not. The counter is '''Not processed due to overload'''. | ||
[[File:Interface analyzer packet drop.png|400px]] | [[File:Interface analyzer packet drop.png|400px]] | ||
Revision as of 13:30, 8 May 2020
About
This guide is about performance optimization of the Allegro Network Multimeter for specific use cases. By default, the device runs in a configuration that fits for the majority of users and you do not need to change any parameter of the configuration. Depending on the actual network traffic and measurement setup, it can be beneficial to adjust some performance-related parameters to achieve better overall performance.
High Level Allegro System Layout
The Allegro Network Multimeter has various components that processes the traffic. These components are:
- I/O threads: responsible for all I/O operations between the network interface cards and the CPUs.
- Analyzer threads: responsible for decoding network traffic and most of the database operations for the statistical values.
- DB threads: optional threads which offload memory intensive database operations, see DB mode.
The Allegro Network Multimeter uses queues to buffer packets and messages between the hardware instances (interfaces chips, central processing unit, storage) and threads. All threads measure their load individually which can be monitored at Info → System Info → Load.
The utilization of the following queues can be monitored to see if and where changes to queue settings are helpful:
Interface hardware queues
The interface hardware queue is between the network interfaces and the I/O threads of the central processing unit. Whenever the I/O threads are too slow to consume all packets from the built-in or extension network interfaces, the hardware miss counter of the Interface statistics will increase over time.
The load of the I/O threads can be checked at the Info → System Info → Load.
TODO: add overloaded Interface graph.
If the load is near 100%, packet miss can occur and the following countermeasures can be tried:
- The bridge mode requires approximately 10% - 30% more load on the I/O threads than the sink mode. The I/O threads have to sent the incoming traffic to the corresponding outgoing network interface for forwarding. If packet forwarding is not necessary (for example when being deployed at a mirror port), switching to sink mode will improve the performance of the device. For configuration, please see Global settings.
- The number of I/O threads can be adjusted at the cost of analyzer threads. This option is available on the Allegro 3000 and above due to the large number of internal CPU cores. Allegro Packets recommends to increase the analyzer threads only on the Allegro 3000 and above if necessary.
- This setting can be changed at Settings -> Global Settings → Expert Settings
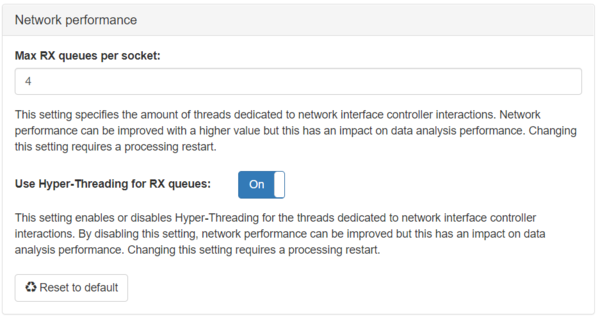
- Allegro Packets recommends to test with HT enabled and 2 or 4 threads for I/O. If you disable the load on the analyzers ( see #High analyzer load ), you can also test with 4 I/O Threads without HT for maximum performance.

Analyzer queues
The Allegro Network Multimeter has a packet queue between I/O threads and the analyzer threads. Please note that the increasing counters at the initial startup of the Allegro can be normal under high load scenarios for a few seconds. You can check at the Interface stats per interface all I/O threads could push all packets to the analyzer queues or not. The counter is Not processed due to overload.

The load of the analyzer threads can be checked at the Info → System Info → Load. Depending of your Allegro there could be a 2 ( Allegro 200, Allegro 500 ) up to 120 ( Allegro 5300 or 5500 ) analyzers.
There are 3 scenarios where the an queue overload can happen.
Overload at low analyzer load
This happens if the analyzers of the Allegro are in a powersafe mode and a very high and large burst of one connection arrives at the Allegro. This issue has happened at customer installations with 40G Links, an average saturation less than 5GBit/s and connection bursts above 10GBit/s. This can lead to minor packet drops as the wakeup of the analyzers is not fast enough. The solution is to use the #Sink Mode and to activate the Analyzer queue overcommit at Settings → Global settings → Expert settings. This mode allows to buffer network bursts. This mode is not available for the bridge mode.

Overload and high analyzer load
The Allegro has reached its processing limit for a traffic when the load of one or multiple analyzers reaches 100 %.
There are a few options for reducing the analyzer load but it always comes with the penalty of not processing all data. You can reduce the statistic level or add a NIC filter.
You can reduce the level of analysis at Settings -> Global Settings.
![]()
Every Level reduction will reduce the amount of analyzed data and saves database operations, see Global_settings#Limit_module_processing for more details of this mode. You can use this mode to store high packet rates into the ring buffer and re-analyze parts of it with full analytics with the Parallel packet processing.
The NIC filter can be used to reduce the amount of monitored traffic. It excludes traffic from the analyzers for the cost of not-seeing all traffic of the link. See the interface filter for more details.
If this is not applicable, you need to upgrade the Allegro to a higher class with more performance ( Allegro 1000 to 3000 or 3000 to 5000 ).
Overload and not-balanced analyzer load
By default, the Allegro load balances the traffic between the analyzers based on the IP addresses of the client and server IP. This provides a very good balancing in most situations. The load distribution could be not balanced if there are many connections and load between 2 IP addresses. An example are 2 SIP trunks with many RTP connections. The statistics will show a part of the analyzers with a constant high load and others with a significant lower load.
The load balancing behavior of the Allegro can be changed to flow load balancing mode at Settings -> Global Settings → Expert Settings.

This mode improves the performance only for unbalanced traffic. Please use it only if required as it has a negative performance impact on balanced traffic.
Database queues
The database mode is an extension for large Allegros with NUMA setups and it is disabled by default. This mode is only recommended for Allegro 3500 rev1 and Allegro 5500 rev1. It helps improving very high database loads ( millions of open connections and new connections ) over multiple cpus. See DB mode for more details.
If enabled, you can check if there are message drops between the analyzer threads and the DB threads in the load statistics.
Disk I/O queues
The analyzer have software queues for each disk or each disk cluster. Storage devices like HDDs and SSDs do not offer a constant write rates and have sudden write slowdowns. Please read the performance guide for the ring buffer Ring_Buffer_Configuration_Guide#Performance.
The 2 generic solutions are to increase the buffer and to use filter rules. Both will reduce the load of bytes that are written to the disk.