IP module
The IP module operates on layer 3 of the network stack. It stores information about all IPv4 and IPv6 addresses. For every address, the corresponding network traffic is accounted, the used protocols and their individual traffic. The communication peers are stored as well as the traffic between both IP addresses. Every connection with its amount of traffic and the protocol can be accessed.
IP addresses tab
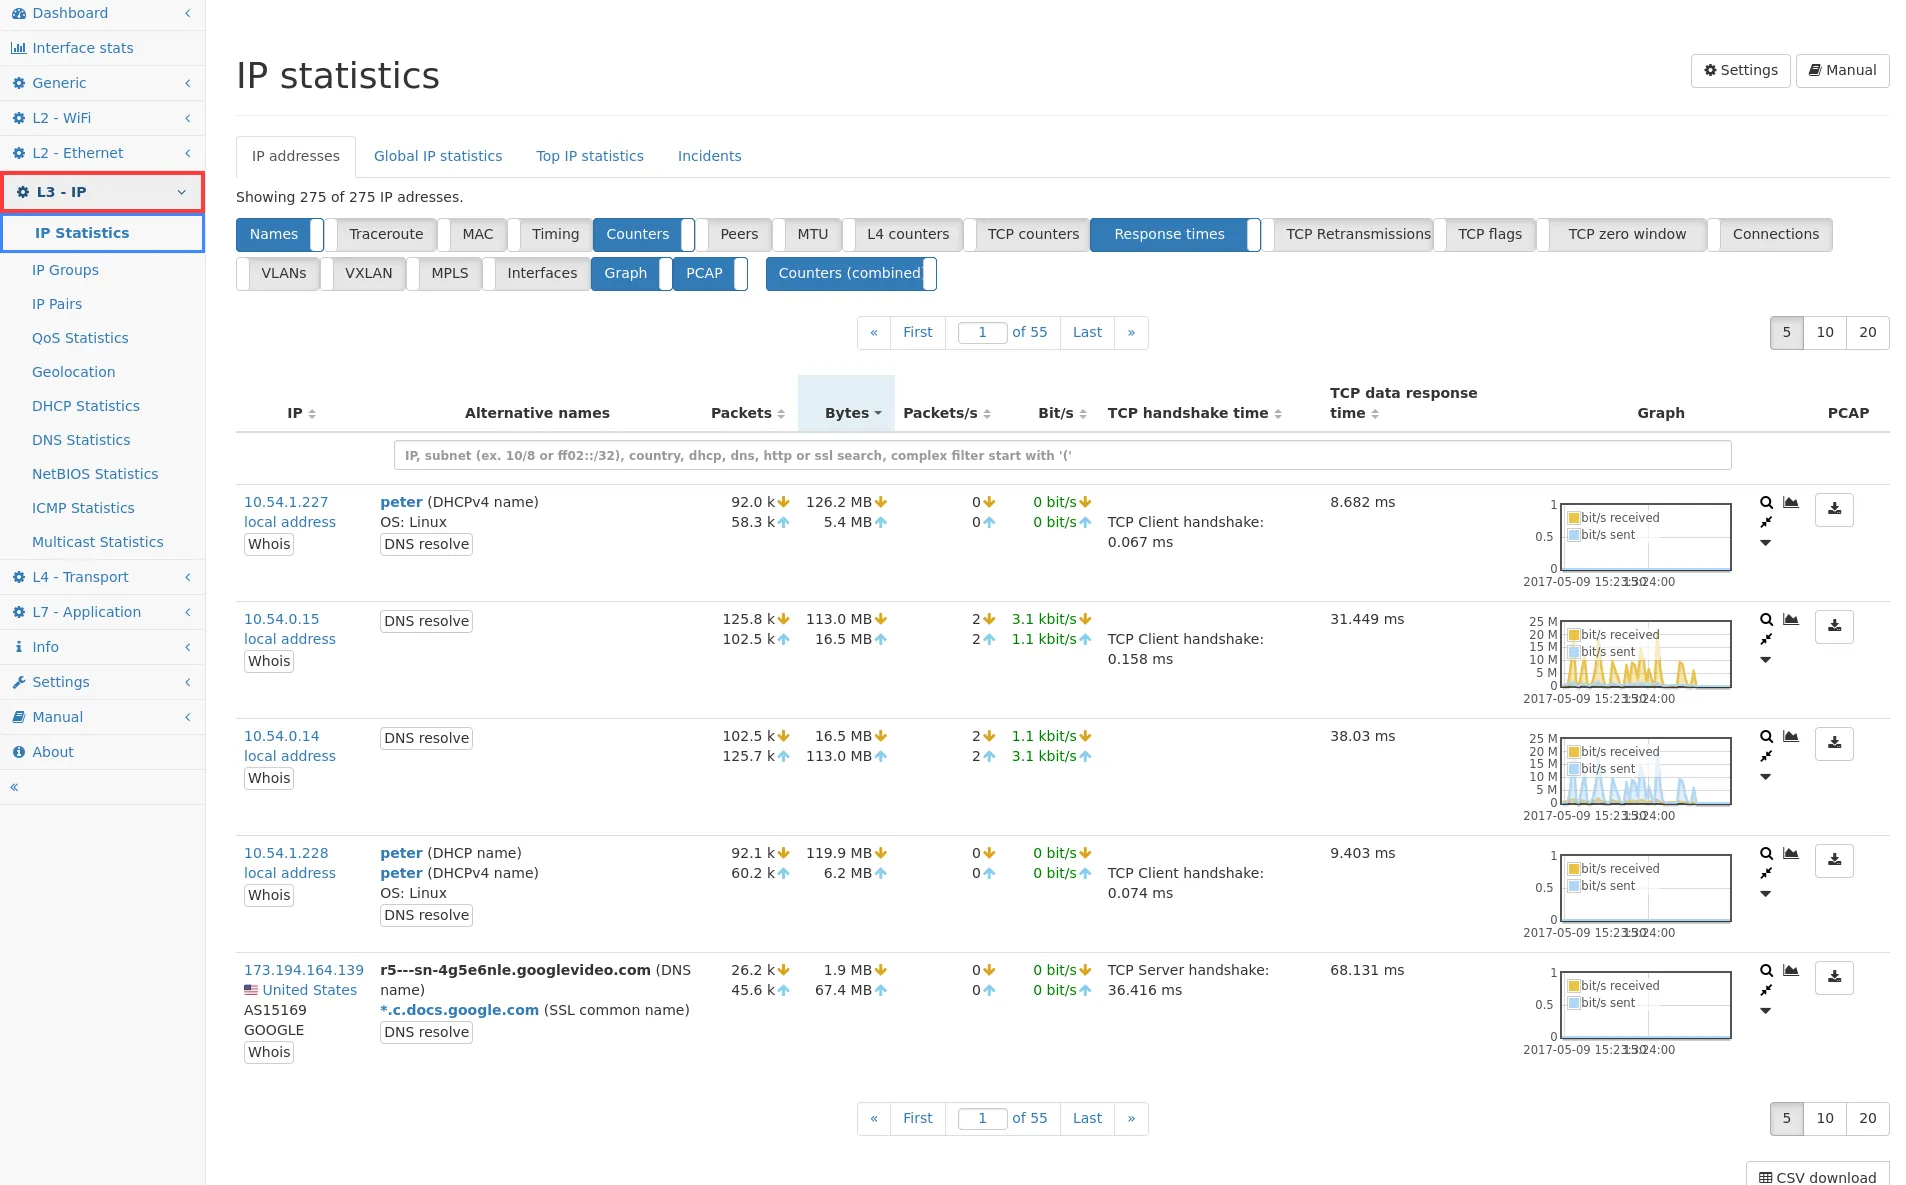
Section titled “IP addresses tab”The IP addresses tab shows the complete list of all IP addresses seen by the system. The button row allows to select specific information to be shown or hidden so that only the relevant information fits on the screen. By clicking on Counters (combined) the table toggles between sent and received bytes and packets displayed in either one column or in separate columns for sorting purposes. For each address, the table contains the following information:
-
IP: See Common table columns - IP.
-
Alternative names: See Common table columns - Alternative names. The name information are also used when filtering the table for some entered string.
-
Traceroute: A traceroute for the IP can be requested or updated using the available button. When traceroute information is available for the IP, brief information about each found network hop (IP, hostname, ping response time) is displayed. Since this list of hops can get very long, the view can be toggled to show all found hops or just the last one by clicking on the traceroute header.
-
First (recent) activity: See Common table columns - First (recent) activity.
-
Last activity: See Common table columns - Last activity.
-
Packets and Bytes: See Common table columns - Packets and Common table columns - Bytes.
-
Packets/s and Bit/s: See Common table columns - Packets/s and Common table columns - Bit/s.
-
Peers: This shows the amount of peers of this IP. This counter is an all time only value and does not consider a selected interval.
-
TTL: This shows the min, max and average TTL value (or hop limit in case of IPv6) of TCP/UDP traffic of an IP address. Non-UDP and non-TCP traffic as well as multicast traffic is ignored as e.g. ICMP packets likely have very high TTL values of 255 at the sender.
-
MTU: The maximum transmission unit (i.e. layer 2 payload) is calculated for both receive and send direction. The maximum values are displayed.
-
TCP packets and UDP packets: This is the number of TCP and UDP packets that have been seen for this IP.
-
TCP handshake time and TCP data response time: The average time for a handshake as a TCP client and/or a TCP server is displayed as well as the average time the IP takes to acknowledge TCP data.
-
TCP application time: The TCP application times are shown as aggregated values from each connection.
-
TCP payload and retransmissions: These two columns show the number of bytes transmitted as TCP payload and how many bytes have been retransmitted, indicating a bad connection quality.
-
SCTP retransmissions: This column shows the number of retransmitted SCTP packets in either direction. Retransmissions are recognized based on transaction sequence number for DATA and I-DATA chunks. Only the first DATA/I-DATA chunk is considered for the time being.
-
Top QoS: The seen Quality of Service classes for that IP address for both sending and receiving direction. This is a list with the top 5 classes only, sorted by traffic. The full list is available in the IP details.
-
Graph: See Common table columns - Graph. Available data sources are load (bps or packets/s), TCP statistics or connections.
-
PCAP: See Common table columns - PCAP
When multiple pages are available, there will be a control field for
switching pages. The IP search bar allows to enter IP addresses or names
to see only those elements for which the entered string is part of the IP
address or name. Also, complex filter expressions are possible, if the
string starts with an open parenthesis (. See Live filtering of
tables for a
detailed description about how to use this feature. The columns can be
sorted also, for example to easily spot the IP addresses with the most
bytes, or the highest current throughput.
Below the table a CSV download button provides the ability to download the whole table contents in CSV format. Sorting and filtering are applied as selected for the table but all IPs in the table are exported, not only the currently visible page.
Global IP statistics tab
Section titled “Global IP statistics tab”The Global IP statistics shows global sums about the processed IPv4 and IPv6 traffic and often used layer 4 protocols. Non-IP packets such as ARP packets are indicated as other traffic and are not covered by this module. The available information is:
- Layer 3 protocols: IPv4, IPv6 and non-IP traffic, its distribution over time and a history graph.
- Layer 4 protocols: TCP, UDP and traffic for other often used layer 4 protocols, its distribution over time and a history graph.
- IPv4/IPv6 Fragmentation: amount of fragmented and unfragmented packets, its distribution over time and a history graph.
For layer 3 and layer 4 protocols, traffic can be downloaded by clicking on the PCAP download button. To stop capture, click on the same button again (which turned to a STOP symbol), or go to Generic → Capture traffic and stop the corresponding download.
Top IP statistics
Section titled “Top IP statistics”On this page pie charts are shown with the top 10 sending and receiving IP addresses. By clicking on a pie chart section the related IP detail page is opened.
Per IP statistics
Section titled “Per IP statistics”It is possible to select an IP from the list of IP addresses and get a more detailed view of the information stored about that IP. The headline of the page includes three buttons. The first left arrow button navigates back to the complete IP overview. The second download button allows to download the traffic for the current IP address. The third button allows for opening this manual section. Below the buttons there are two graphs for the packets and bytes sent and received by the IP address. The third section contains tabs for various information about the selected IP.
Overview tab
Section titled “Overview tab”This tab summarizes all the standard information from the main IP view, such as
- the alternative names,
- the packet and bytes counters, and
- the current throughput.
Additionally, the top used protocols are printed both in the table as well as a pie chart at the bottom of the page.
One row in the table shows the MAC addresses seen for this IP address. There can be multiple MAC addresses for the same IP, for example if the DHCP server reuses the IP address after some time. The last new connection time is the start time of the last connection seen for this IP. There is also a download button to capture the traffic for the specific IP and MAC address pair.
Two rows show all VLAN tags that have been seen for the given IP. An IP address might be visible in multiple VLANs. If the Allegro Network Multimeter is installed at a mirror port of a switch, which also modifies the VLAN tag, it might happen that an IP address is seen without a VLAN tag (none) and a specific VLAN tag. This setup will decrease the quality of the results, as the VLAN information is also used to distinguish connections. The measurement results can be improved if the mirror port is reconfigured to only see traffic with VLAN or completely without VLAN tags.
One row shows the devices interfaces at which the IP has been seen. The displayed interface always considers the sender side of an IP connection. This information helps especially in bridge mode to determine at which side of a link the IP address is visible as sender of packets.
Layer 3 QoS tab
Section titled “Layer 3 QoS tab”This tab lists all seen IP DSCP values for the current IP. Several traffic counters are displayed and a history graph of the traffic over time. A PCAP button allows for capturing the specific QoS tagged traffic for that IP. By clicking on the shown DSCP class name you will be redirected to the Connections tab with a filter active that only shows connections for that specific DSCP value.
Layer 2 QoS tab
Section titled “Layer 2 QoS tab”This tab lists all seen MPLS traffic classes and VLAN priority code points for the current IP. Several traffic counters are displayed and a history graph of the traffic over time. A PCAP button allows for capturing the specific QoS tagged traffic for that IP. By clicking on the shown QoS class name you will be redirected to the Connections tab with a filter active that only shows connections for that specific QoS.
Protocols tab
Section titled “Protocols tab”This tab lists the DPI protocols for the current IP. The download button allows to capture the traffic for the IP and protocol pair.
Peers tab
Section titled “Peers tab”The Peers tab shows all communication peers the current IP address has
talked to. The table contains the IP
address which can
be clicked to see the statistics for that IP. The alternative names are
shown, depending on which data is available (DNS name, DHCP name, NIC
vendor name). The packets and bytes columns show the total amount of
data transferred between those two IP addresses. The list of peers can
be filtered by entering a string into the text area. Also, complex
filter expressions are possible, if the string starts with an open
parenthesis (. See Live filtering of
tables for
details.
Layer 4 endpoints
Section titled “Layer 4 endpoints”The layer 4 endpoint tab shows all peers of the current IP address and the used server port. If the peer is the server, the port of the peer is shown. If the peer is the client, the other port is shown.
The table shows IP addresses with port number, whether the peer acts as a server or client, alternative names, layer 4 protocol and byte and packet counters. If there were multiple connection between the IP address and the peer with the same port, the counters will show aggregated data.
When clicking on Peer connections the connection tab is opened with the filter set to match that particular endpoint.
Connections tab
Section titled “Connections tab”The connection tab lists all connections which involve the current IP. The button rows allow to select which kind of information should be shown.
If a deny list is configured in the Connections module and the current IP (or a subnet it is part of) is on it, a warning is displayed instead. Conversely, if an allow list is configured and the current IP (or a subnet it is part of) is not on it, a similar warning is displayed.
If the current IP is not affected by a filter in the Connections module, but any of its connection partners are, a counter of the connections not accounted for is displayed above the table.
The table contains the following information:
- Client IP/port: Client side IP information (see Common table columns - IP).
- Server IP/port: Server side IP information (see Common table columns - IP).
- Layer 4 protocol: TCP, UDP, or others.
- Go to: Allows to go to the connection details page which shows all information in more detail.
- Start time: The start time is the time of the first packet for that connection.
- Last activity: Shows the time of the last packet seen so far for the connection.
- Duration: Difference between last activity and start time.
- Packets: Number of packets.
- Bytes: Number of bytes.
- Packets/s: Packet rate.
- Bit/s: Bit rate.
- MTU: The maximum transmission unit (i.e. layer 2 payload) is calculated for both directions.
- Layer 7 protocol: Shows the detect application layer 7 protocol.
- TCP handshake time: The time between SYN and ACK.
- TCP response time (max/avg): Contains response times for TCP data.
- TCP application time: Performance metrics for L7 applications (see TCP application time for details).
- Layer 7 response time: Contains response times for the maximum HTTP response for HTTP connections, or the TLS response times for TLS connections. The column also contains a score for this connection and this IP, based on the average response times of the server. See HTTP module and TLS module for additional information. When sorting the column and more than one time value is shown in a field, the maximum of all time values of that field is taken into account.
- TCP retransmissions/TCP retransmission %: Shows the number of bytes that have been retransmitted on TCP layer because of packet loss. High percentage indicate connection problems for this communication pair.
- TCP DUP ACKs: Number of DUP ACK packets.
- TCP missed data: Shows the estimated amount of TCP data not seen for this connection. See TCP module for details about missed data.
- TCP SYNs/SYN-ACKs/FINs/RSTs: Shows the amount of TCP SYN, SYN-ACK, FIN and RST packets per direction. Up to 255 packets can be accounted. If more were seen, >= 255 will be displayed.
- TCP end termination reason: Connection end can be regular FIN, RST, or timeout if no termination is seen at all.
- TCP MSS: The TCP maximum segment size may be announced by the peers using a TCP option during connection negotiation. If the option is not announced, default values will be used. The values represent the payload capacity of TCP packets sent by the peer.
- Max announced TCP window size: Shows the size of the biggest TCP receive window announced for each direction of a connection.
- Min announced TCP window size: Shows the size of the smallest TCP receive window announced for each direction of a connection.
- Max TCP bytes in flight: Shows how much of the TCP receive window of the corresponding direction has been used at max during the lifetime of the connection, in other words this is the bytes in flight of the opposite, sending direction.
- Announced TCP window size limit: The TCP window size limit columns show the maximum possible value that could be used for the TCP receive window size. This is calculated from the announced TCP window scale option for each direction of a connection. The raw window scale (ws) shift count value is displayed in parentheses next to the byte value.
- TCP window limit usage: Shows the ratio of the TCP max window size values compared to the TCP window size limit values in percent.
- TCP zero window packets: Number of TCP zero window packets, which indicated full receive buffer.
- SCTP retransmissions: This column shows the number of retransmitted SCTP packets in either direction. Retransmissions are recognized based on transaction sequence number for DATA and I-DATA chunks. Only the first DATA/I-DATA chunk is considered for the time being.
- Client announced TLS versions/Negotiated TLS version, Client announced cipher suites/Negotiated cipher suite: Shows the TLS versions and all supported cipher suites announced by the client during a SSL client hello. In the negotiated columns the currently used TLS version and cipher suite is shown as indicated by the SSL server hello. As the client announced cipher suite list can be quite long, it is possible to expand or minimize the list by clicking on it.
- TLS alert
- TLS alert level
- Client Announced ALPN Protocol: Shows the client announced ALPN protocol extracted from the extensions of the TLS handshake.
- Validity: Connections are counted as valid if the handshake succeeded or at least some data is transferred.
- Meta data: May contain additional information that could be retrieved depending on the protocol. For instance, for HTTP traffic this column shows the request URL and response code for the last transaction seen in the corresponding connection.
- Outer VLANs: Shows which VLAN tags have been seen for a specific connection.
- Inner VLANs: Shows which inner VLAN tags have been seen for a specific connection in QinQ setups.
- PPPoE session ID: Shows the PPPoE session ID which has been seen for packets of that specific connection. If a PPPoE session ID changes at any time while the connection is active, a changed indication is given. In this case the latter session ID is displayed.
- MPLS labels: Shows all seen MPLS labels for every direction of the connection. The full label stack is shown. A no label indication is given, if no MPLS labels have been used. If a MPLS label changes at any time while the connection is active, a changed indication is given. In this case the latter MPLS labels are displayed.
- QoS: Shows all seen QoS service classes for every direction of the connection. IP DSCP, outermost MPLS traffic classes and outermost VLAN priority code points may be detected and displayed. If a QoS class changes at any time while the connection is active, a changed indication is given. In this case the latter QoS service classes are displayed. TCP RST packets will be ignored, as that packet may be less important and is indicated by a QoS class with lower priority than the previous packets with data.
- Interfaces: Shows at which interface the connection has been established. This is especially helpful in bridge mode to determine at which side of link the connection has been established.
- Two-way latency avg/min/max interval, One-way latency avg/min/max interval: Statistics from the path measurement.
- Graph: Shows the historical throughput for each connection, it is possible to select the displayed graph from multiple different statistics (see Common table columns - Graph). Some may only be available if module options has been enabled, as it will increase the overall memory usage. Some statistics, like the path latency, are only available, if the path measurement module is active (and the corresponding option to store latencies per connection is enabled).
- PCAP: Allows for capturing the specific connection (see Common table columns - PCAP).
The list of connections can be filtered by entering a string into the
text area. Also, complex filter expressions are possible, if the string
starts with an open parenthesis (. See Live filtering of
tables for
details.
A detailed connection view can be accessed by clicking on Details in the Go to column.
CSV download
Section titled “CSV download”The connection list can also be downloaded as a CSV document by clicking the CSV download button. The current filter and sort order is used when creating the CSV file.
The CSV file can also be accessed without using the web interface by getting the following URL:
/API/stats/modules/ip/ips/x.x.x.x/connections?csv=true
x.x.x.x must be replaced with the actual IP address. Additional URL parameters can be used to choose a time span, applying filters, etc. See REST API description for details.
Open TCP server ports
Section titled “Open TCP server ports”This tab shows the list of ports for which the IP address has accessed incoming connections. It shows which service is (usually) behind the port. Additionally, the first and last connection time is shown as well. Also, there is button to capture traffic for the current IP and the corresponding port.
TCP statistics
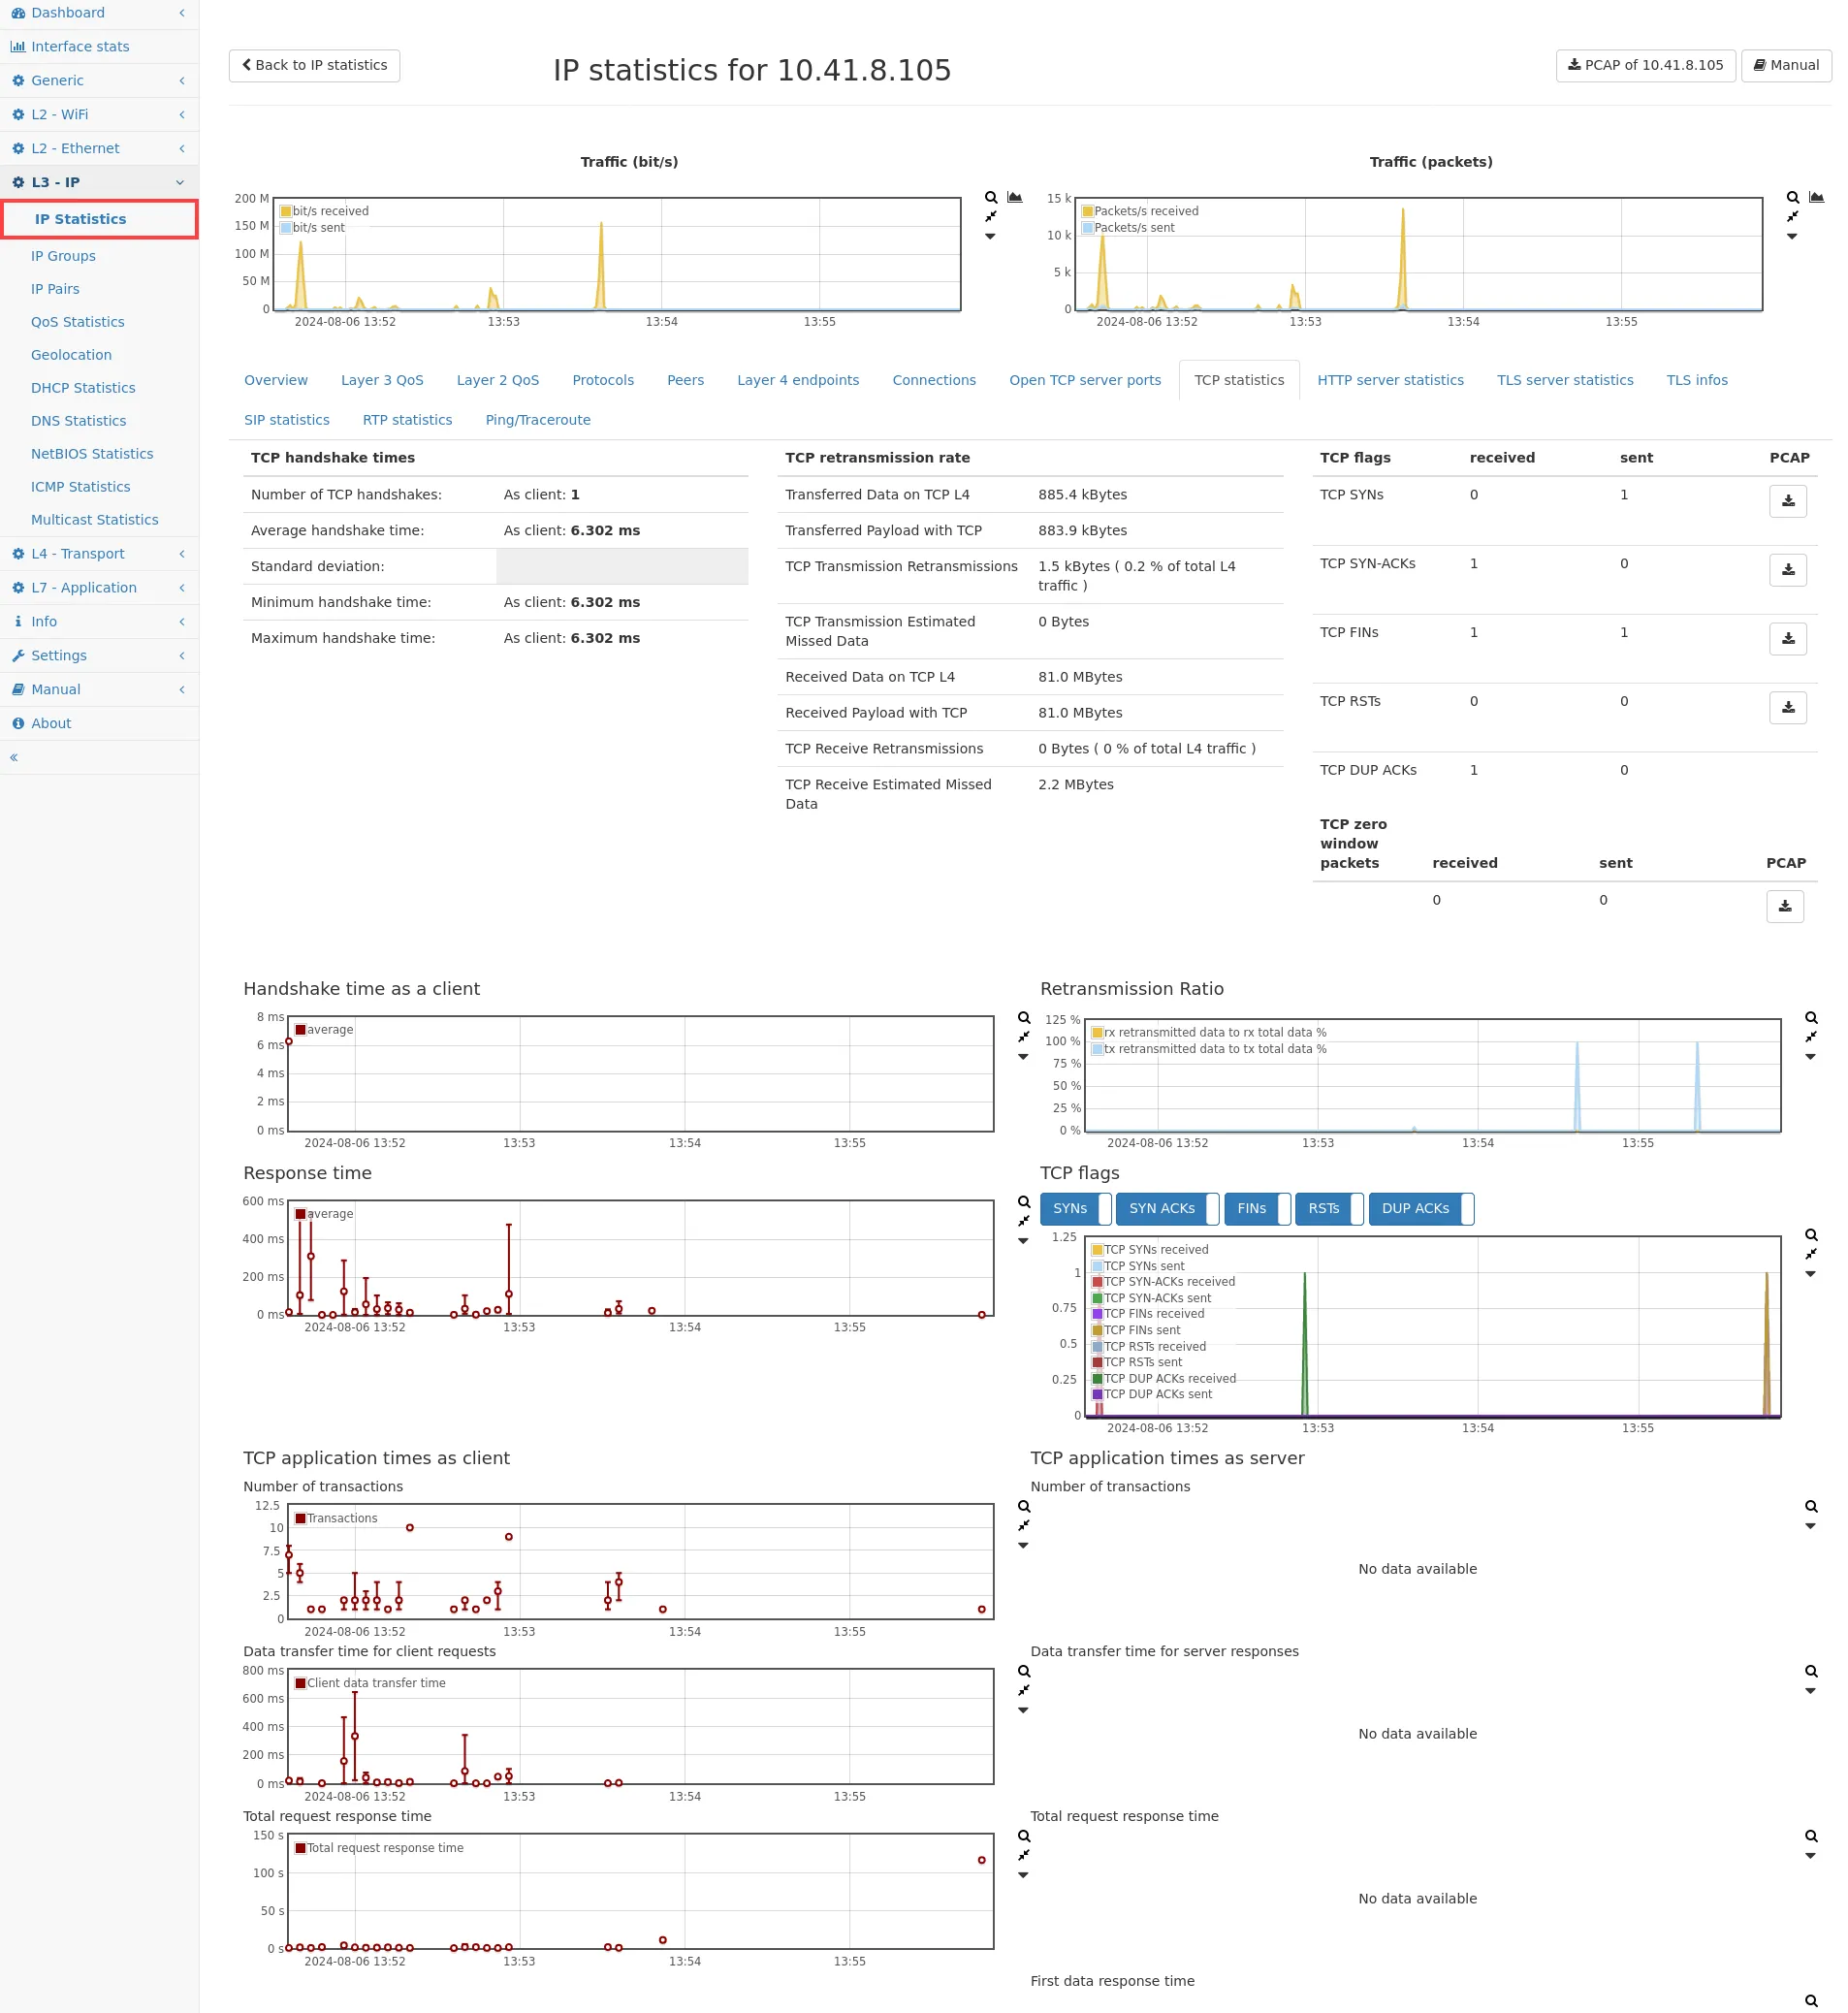
Section titled “TCP statistics”This web page shows statistics about the response time of TCP connection handshake of all TCP connections of the current IP address. Also, the amount of data retransmitted due to packet loss is shown. When TCP data has not been seen for TCP connections, the estimated amount is shown as well (see TCP module for details).
The graphs below show the historical data for each TCP handshake. The data point is the average handshake time and the vertical line shows the min and max handshake time for that specific time window (depending on the zoom level). Up to two graphs might be visible, one for data when the IP connected to other IPs as a client, and another graph for data when the IP has been connected from other IPs as a server.
The TCP application times show infos about data packets being transferred between the clients and server. For each TCP connection, the following key attributes are measured and reported:
- Transactions: This metric indicates the count of data transaction cycles, allowing you to track the volume of activity over time.
- Data Transfer Time: This measures the time interval from the first data packet to the last consecutive data packet sent from the same side, giving you a clear picture of the data flow duration.
- First Data Response Time: This tracks the time between the last data packet sent and the first data packet received from the other peer, marking the conclusion of a transaction cycle.
- Total Request-Response Time: This attribute captures the time interval from the first client data packet to the last server data packet during the entire request-response cycle, offering a comprehensive view of transaction latency.
See TCP application time for more details about these values.
The connection table below shows a subset of the main connection table only for TCP connections for this IP. When sorting the handshake and response time columns and more than one time value is shown in a field, the maximum of all time values of that field is taken into account.
HTTP server statistics
Section titled “HTTP server statistics”This tab shows statistics (if available) of all HTTP requests handled by the current IP address. The statistics contains:
- HTTP server names: All host names are shown that have been used to contact the HTTP server on this IP.
- Sent HTTP responses: This is the total number of requests/responses that have been seen on the network.
- Average response time: This is the average response time in milliseconds for all servers.
- Standard deviation: This value shows the variation of the response times (en.wikipedia.org/wiki/Standard_deviation).
- Minimum response time: This is the smallest response time seen on the network.
- Maximum response time: This is the largest response time seen on the network.
The graph shows the historical data for all responses. Below the graph, the number of response codes for each main code family is shown together with the last URL requested.
SSL/TLS server statistics
Section titled “SSL/TLS server statistics”This tab shows statistics (if available) of all SSL/TLS requests handled by the current IP address. The statistics contains:
- TLS server names: All host names are shown that have been used to contact the SSL/TLS server on this IP.
- Response time for TLS hello handshake
- Number of TLS handshakes: This is the total number of SSL/TLS requests/responses that have been seen for this IP.
- Average time of handshakes: This is the average response time in milliseconds.
- Standard deviation: This value shows the variation of the response times (en.wikipedia.org/wiki/Standard_deviation).
- Minimum time of handshake: This is the smallest response time.
- Maximum time of handshake: This is the largest response time.
- Response time for first TLS data
- Number of available first data responses: This is the total number of initial SSL/TLS data requests/responses that have been seen for this IP.
- Average time between first data and its response: This is the average response time in milliseconds.
- Standard deviation: This value shows the variation of the response times (en.wikipedia.org/wiki/Standard_deviation).
- Minimum time between first data and its response: This is the smallest response time.
- Maximum time between first data and its response: This is the largest response time.
The graphs show the historical data for all handshakes and SSL/TLS first data responses
SSL/TLS infos
Section titled “SSL/TLS infos”This tab shows statistics (if available) of all negotiated SSL/TLS versions and cipher suites used by the current IP address, either as server or client.
In case of an SSL/TLS client, this tab will also show the supported SSL/TLS versions and cipher suites that have been announced by this client IP address.
SIP statistics
Section titled “SIP statistics”This tab shows statistics (if available) of all SIP request methods, all SIP response types as well as all SIP request/response pairs sent or received by the current IP address.
RTP statistics
Section titled “RTP statistics”This tab shows statistics (if available) of all RTP connections which involve the current IP address as either client or server. A list shows all connections with client and server IP addresses and ports. The RTP payload type is shown as well as timing information and counters, jitter, packet time delta, MOS and R values and SSRC (synchronization source) of both client and server. The min and max audio levels (decibel relative to full scale, dBFS) per direction are shown if G.711 A-Law or μ-Law is used. For calculation, raw A-Law or μ-Law values are converted to 16 bit PCM values. Those values are then converted to dbFS:
value_dBFS = 20 * log10(abs(pcm_value) / 32768)Values range from 0 dBFS (loudest) to -96 dBFS (absolute silence).
Graphs per connection show packets and packet loss, jitter, packet time delta, MOS, R value and the max audio level of client and server over time. A PCAP button allows for PCAP capturing.
If a supported codec is used, audio capture buttons for both directions are available allowing downloads in MP3 format. The following codecs are supported for audio extraction:
- G.711 A-Law and μ-Law
- G.722
- G.729
Ping/Traceroute
Section titled “Ping/Traceroute”A traceroute to the IP can be started or updated by clicking the Traceroute/Update button. Available traceroute data is shown in a table, containing details of each discovered network hop. The following hop information may be displayed:
- IP address.
- Host name.
- Round trip time (average, minimum, maximum).
- Rate of received responses to sent requests.
- Dropped packets count.
- Country.
- City.
- Link to watch the location in online map services Google Maps or OpenStreetMaps.
A button is available to easily navigate to the traceroute configuration section.
IP connection details
Section titled “IP connection details”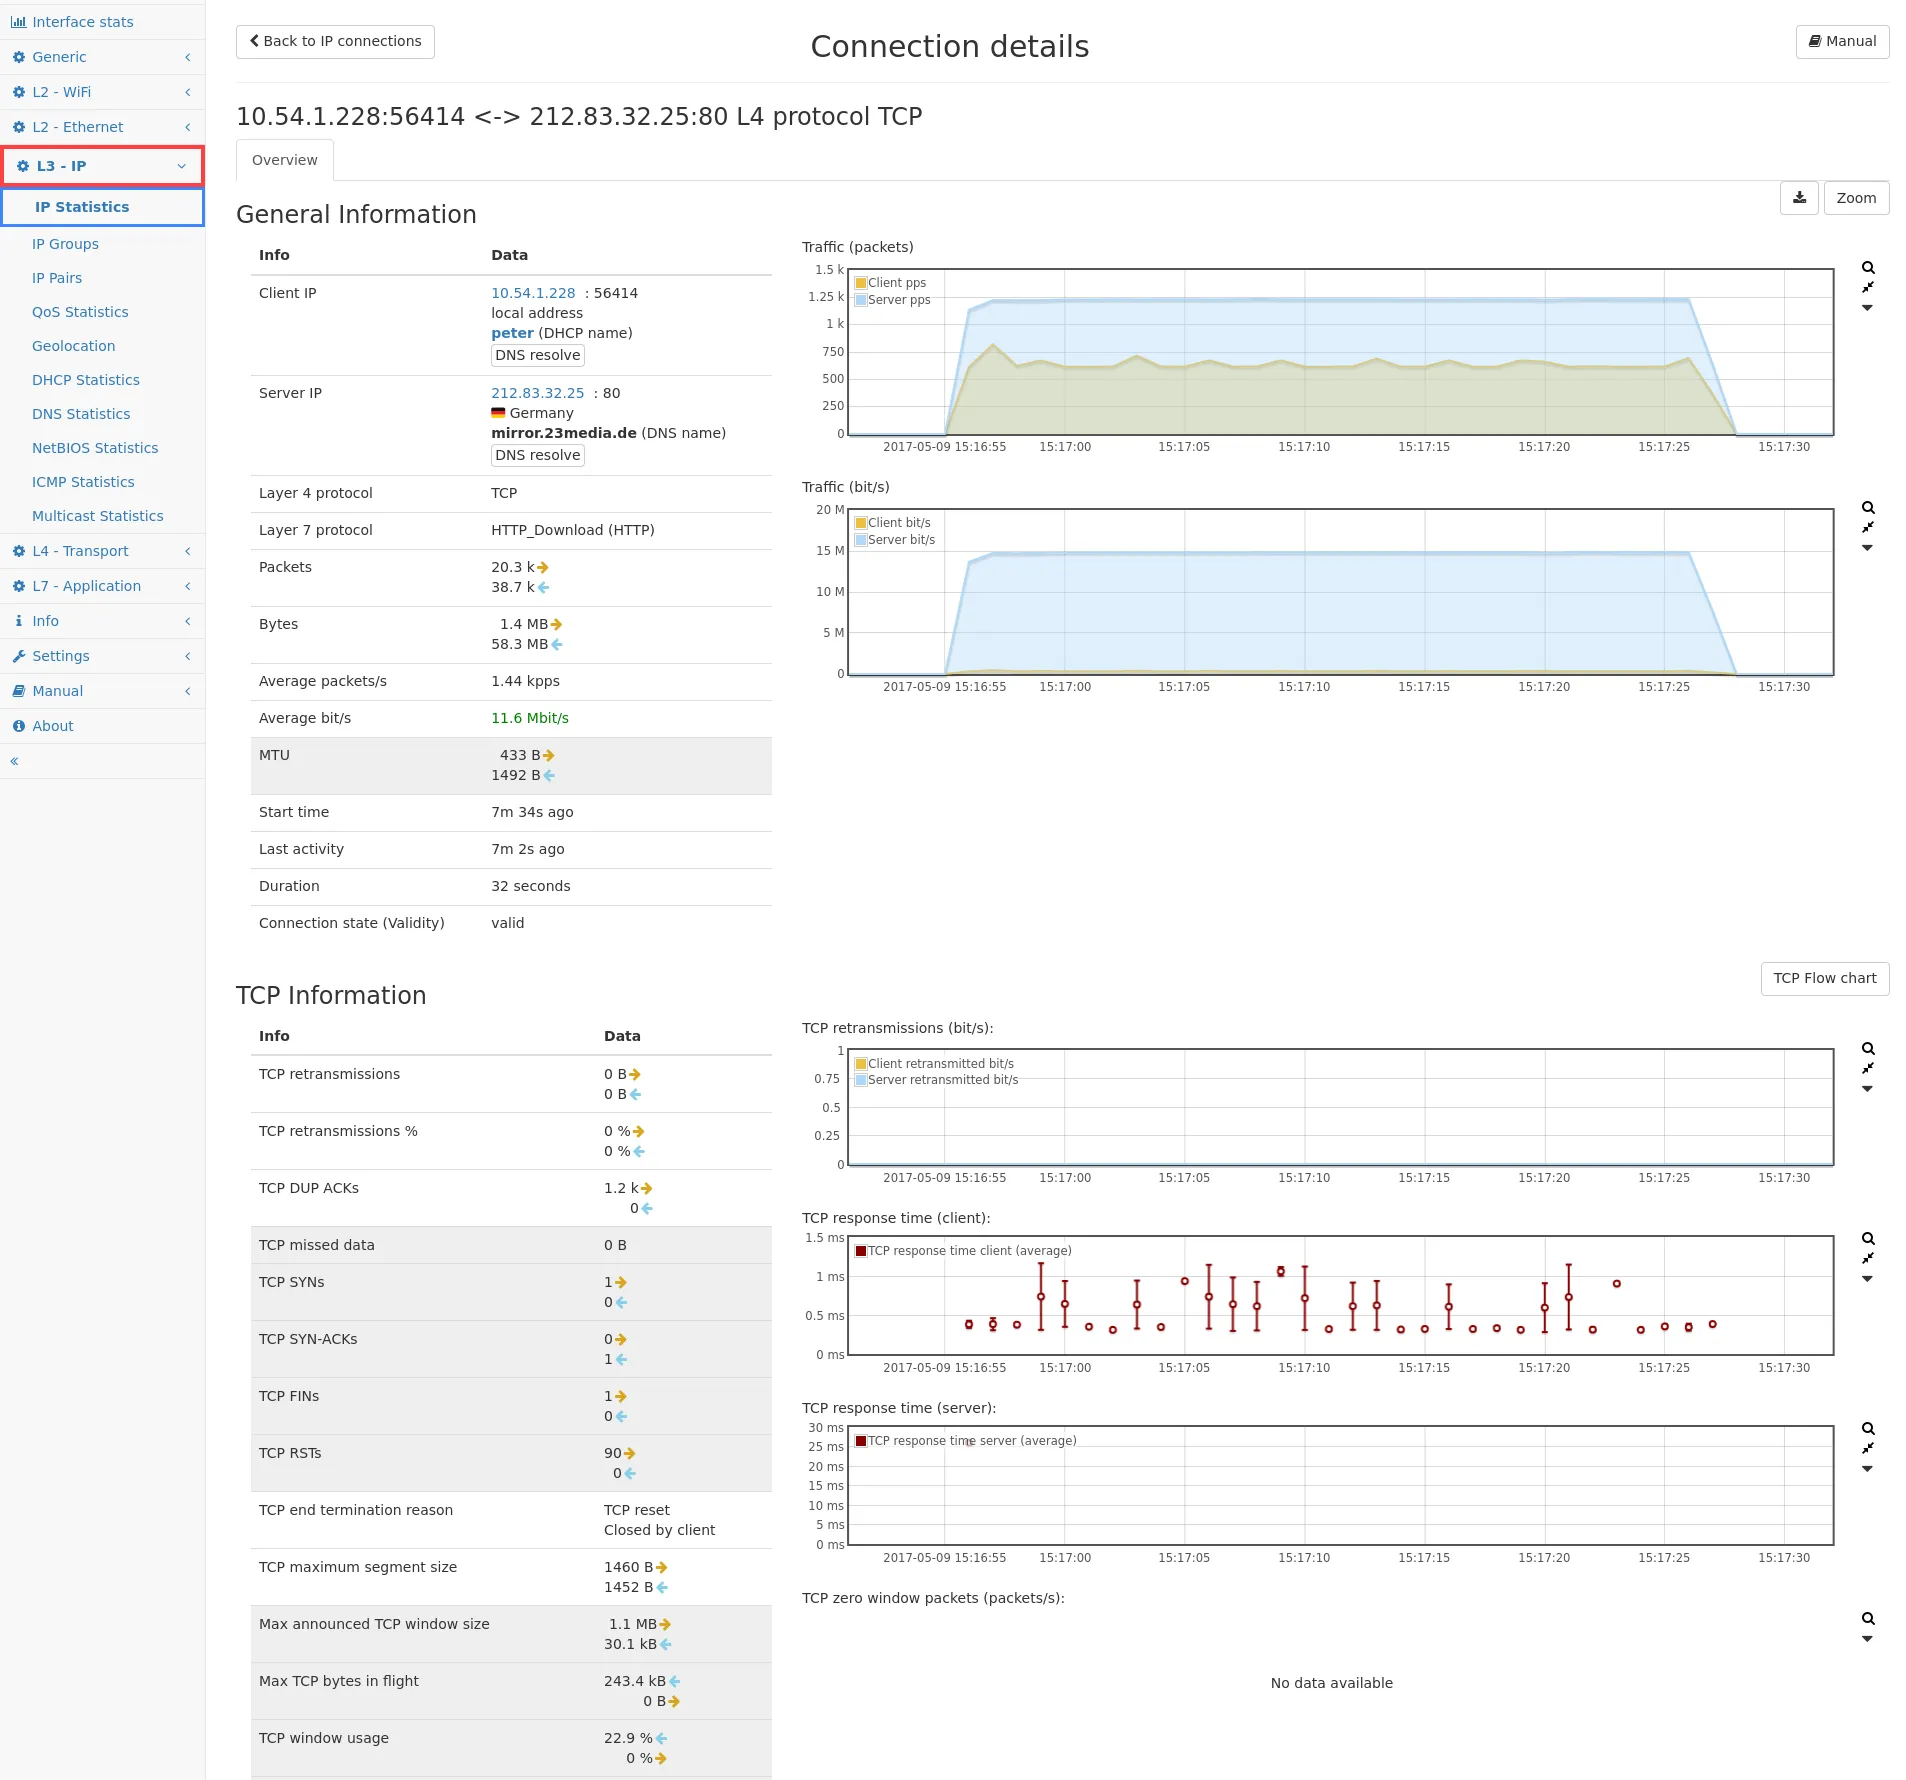
The connection detail view shows connection information in a single page. The view can be accessed in the list of IP connections (or the global connection list) by clicking on Details in the Go to column.
The page shows all data in a tabular format as well as all graphs that are available for the connection.
A capture button at the right hand side can be used to capture packets of that connection.
The zoom button selects the time range in which the connection was active.
For TCP connections a TCP flow chart can be calculated by clicking on the corresponding button:
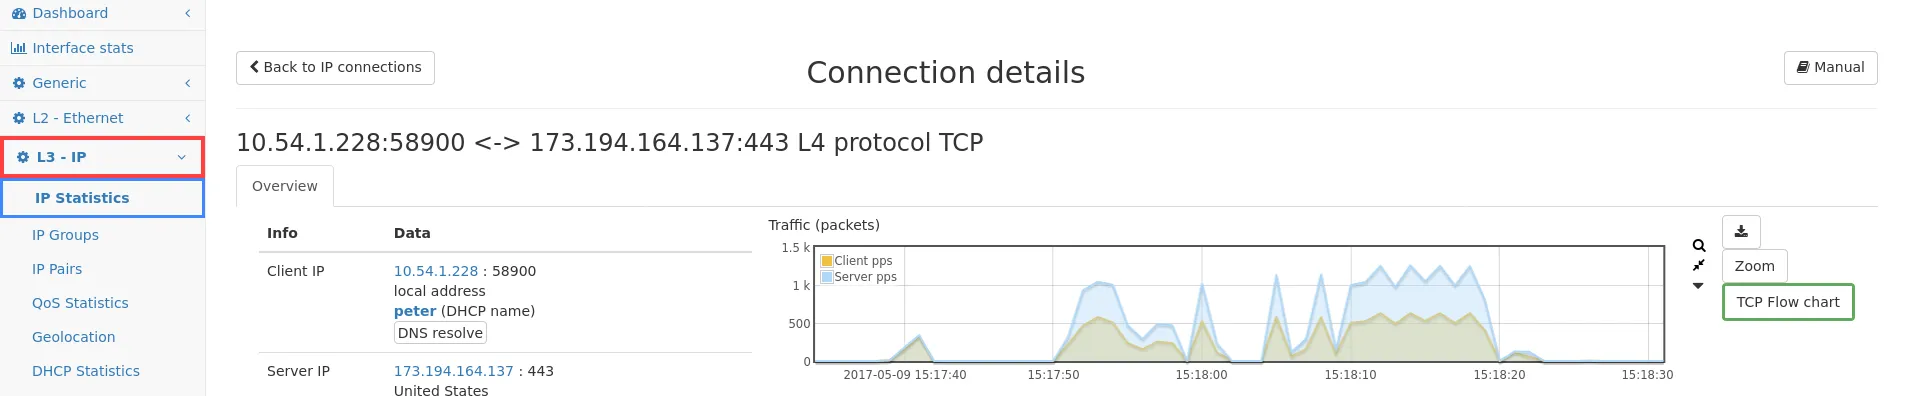
See also IP connection details.
Configuration settings
Section titled “Configuration settings”By clicking on the Settings button on the top right of the IP statistics page, you can access the configuration section.
-
Store connection information for every IP: This option is enabled by default.
When enabled, the IP measurement module stores every connection for each IP. This includes historical packet counters so you can see for an individual connection at which time the connection transferred which amount of data. Connection data will be stored as long as possible regarding the total memory usage. Disabling this option will increase the minimum storage time significantly. Disabling this for only some connections can be achieved by configuring a filter in the Connections module.
-
Store layer 7 protocol information for every IP: The network protocols and their historical traffic data is stored for each IP if this option is enabled. Disabling this option will increase the minimum storage time slightly.
-
Track number of new connections for every IP: When this option is enabled, TCP connections per IP will be tracked. Connections are divided into valid and invalid connections for server and client direction and the amount is shown. Disabling this option will increase the minimum storage time slightly.
-
Store traffic history graph for IP peers: This option allows enabling or disabling the traffic history graph that is shown per peer in the Peers tab for an IP. Disabling this option will increase the minimum storage time slightly.
-
Store RTP performance information per IP and connection: This option allows enabling or disabling of RTP related statistics that are shown in the RTP statistics tab for an IP. Jitter, packet time delta and MOS calculation in the SIP module also depend on this switch since it partially shows information stored at the IP address of RTP senders/receivers. Disabling this option will reduce the memory utilization and therefor increase the minimum storage time slightly.
-
Store QoS information for every IP: This option enables or disables the storage of Quality of Service information per IP. These information require additional memory, so if these information are not necessary, memory can be saved to increase global data storage time.
-
Store SSL/TLS information for every connection: This option enables or disables the storage of SSL/TLS information per IP. This includes used and announced encryption ciphers, which can take additional memory per IP connection. If these information are not necessary, memory can be saved to increase global data storage time.
-
Store detailed TCP statistics for every connection: This option allows to store detailed TCP statistics per connection, such as TCP retransmissions or TCP response time. The graph type can be selected in the IP connection tab to access these information.
-
Maximum number of IP groups: This option configures how many IP groups can be defined. The minimum (and default) value is 32 IP groups. The maximum value is 65535 IP groups. A new configuration value only takes effect after restarting the packet processing in the Settings → Administration menu.
-
Maximum number of HTTP requests per connection: This option configures how many HTTP request/response tuples are stored by default. The default is 1. On global and IP detail connection page it is possible to download CSV file with either the last or all HTTP request/responses per connection. In the latter case each connection line is duplicated with another HTTP request/response in chronological order.