Path measurement
The path measurement module allows to passively measure the packet loss and latency at up to 8 measurement points. These can be between multiple Allegro Network Multimeter installations, or on a single device with traffic from different locations.
For example, a network connection (line/link) between the main office and a remote office can be analyzed by installing one Allegro Network Multimeter at the main office and another Allegro Network Multimeter at the remote office.
Only network traffic (packets) passing through at least two Allegro Network Multimeters can be analyzed. The packet loss and two-way-latency thereof is measured and shown in graphs.
The time synchronization setting (e.g. NTP/PTP or OFF) should be the same on both devices for the best results.
It is also possible to use a single device to measure the traffic delay/losses between different virtual link groups. In this mode, the primary device is used as client devices too.
PCAP capture files can be compared to do an offline path measurement with previously captured files in different locations.
Live analysis
Section titled “Live analysis”In live analysis mode, the packets are either gathered from the local device and configured remote Allegro Network Multimeters, or from different sources on the same local device (different interfaces, different VLAN tags, or similar parameters available through virtual link group configuration).
PCAP analysis
Section titled “PCAP analysis”In PCAP mode, PCAP files are processed and the matching packets are used to determine the delay and possible loss between multiple files. For best results, the file should be recorded on the same device (by running captures simultaneously from different interface sources), or from devices with good time synchronization.
Overview
Section titled “Overview”The main device captures packet meta data from the remote (or client) device which takes only a fraction of the total traffic. Approximately 5% additional bandwidth is required for this capture connection. So for a fully loaded 100 Mbit/s connection to the remote location an additional load of ~5 Mbit/s is required to get packet information to the main device.
The measurement connection can be a separate line or can be run over the line that is measured, the capture connection will be automatically ignored for the measurement.
The measurement module must be configured with a maximum packet delay. This delay describes the amount of time the main device waits for packet information to arrive from the remote device. The delay must be large enough to cover the actual latency of the connection and delay of the capture connection. Typical values are between 2 and 5 seconds. Larger values require more memory to buffer packet meta data so very large values might only be selectable on larger Multimeter devices (Allegro 1000 or greater).
Configuration live measurement
Section titled “Configuration live measurement”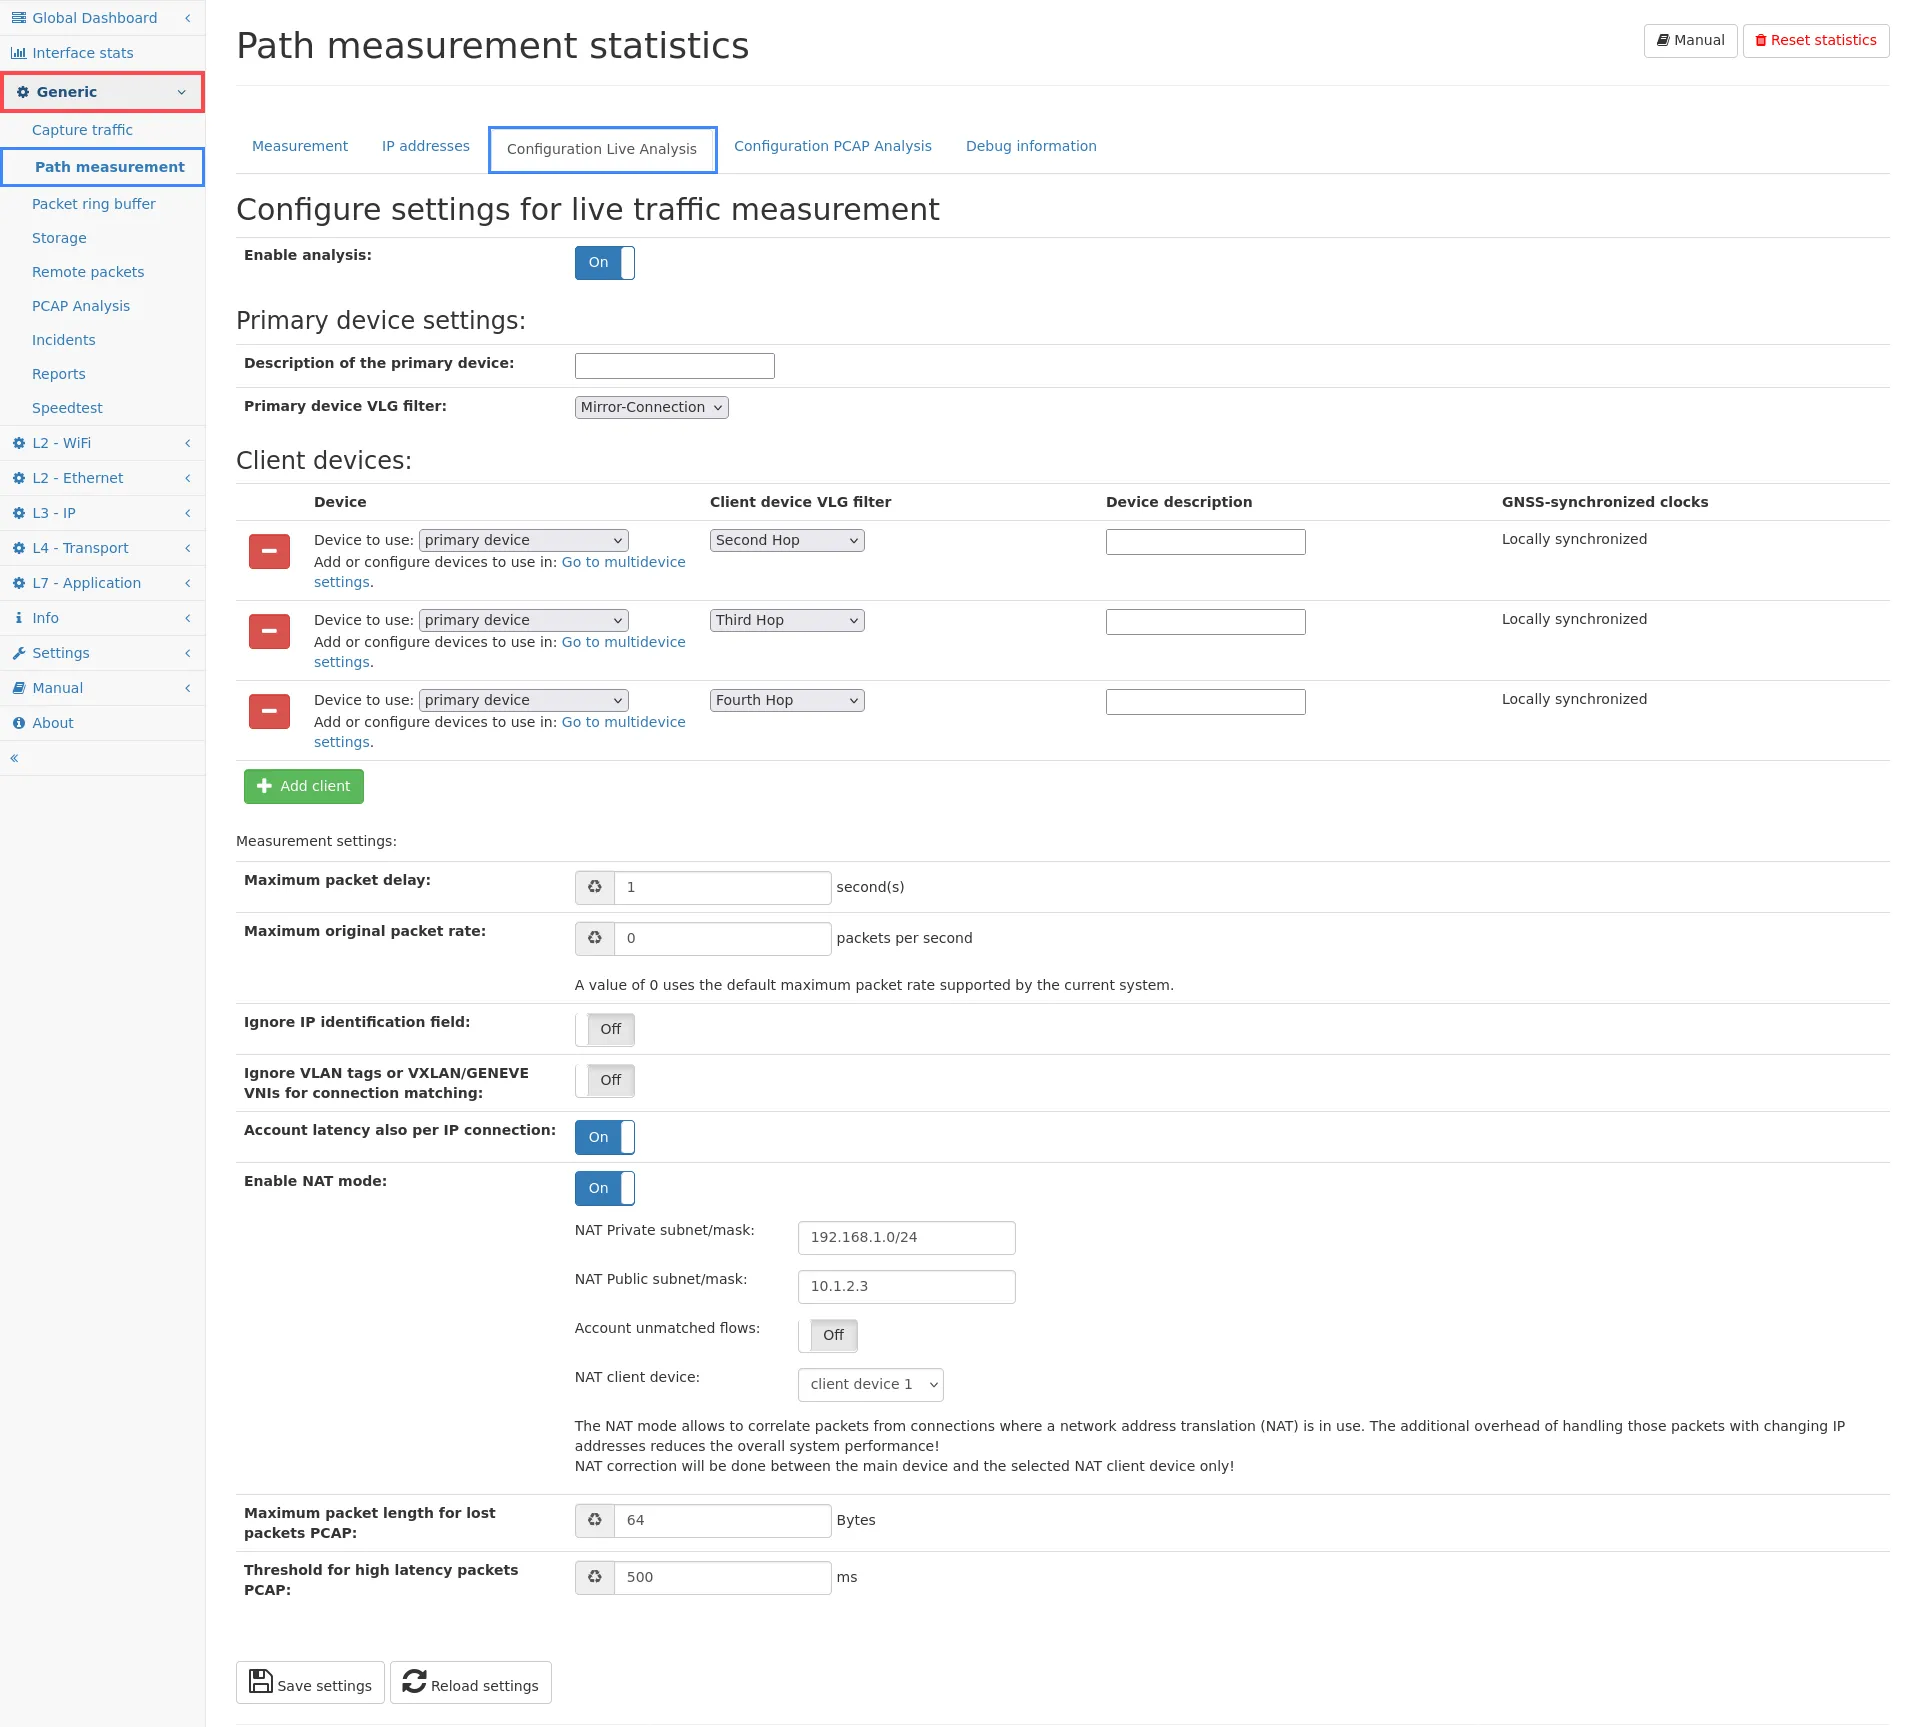
Settings
Section titled “Settings”- Enable analysis: This will disable or enable the path measurement feature. When disabled, no additional memory is used. When enabled, memory for the packet buffer is used which cannot be used for other analyzing modules thus reducing the maximum time the device can go back in time.
Primary device settings:
- Description of this main device: This field is only used for informational purposes to identify the main device. It can be freely chosen, for example to the location the device is installed. This field can also be left empty to use the default name main.
- Primary device VLG filter: It is possible to limit the amount of data analyzed by any configured virtual link group. Often, the primary device is located at a central network point and thus sees a lot of traffic that is not actually going to the remote device. The algorithm will automatically take this into account, but using a filter will reduce the processing overhead as well as the amount of data that needs to be buffered.
The following Client device configuration section configures the access to the remote devices. At least one client must be configured and up to 7 clients can be configured in total. For each client, the following settings can be configured:
- Device to use: To use a remote device for path measurement, you first need to add that device as a remote device to the list of Multi-device settings. It does not matter if the device is active or not. You can select the device from the list of known multi-devices. You can also select the primary device as a client to analyze the traffic between two different virtual link groups.
- Device description: Similar to the description of the main device, this field is for informational purpose only and has no other effect than help identifying the remote device in the statistics. Usually the location of the remote device is entered.
- Client device VLG filter: The traffic used for comparison at the
main device can be filtered to any virtual link group defined at the
client device. There are two main purposes for this setting:
- Reduce the amount of data required to be transferred to the main device. The path measurement only considers connections seen on both devices, but the client device of course cannot know if any connection it sees is also visible on the main device. If only traffic of a specific virtual link group (VLG) actually reaches the main device, using this filter can reduce the amount of data transferred and later dismissed.
- Filter duplicate traffic: If, for some reason, traffic is seen multiple times, it can create wrong results as the number of occurrences differs from main to client devices. A VLG filter can fix this problem by only considering one part of the total traffic.
- GNSS-synchronized clocks: If the selected device is a remote device and both primary and client device have GNSS time synchronization enabled, this option can be enabled to generate one-way latency instead of regular two-way latency.
Measurement settings:
-
Maximum packet delay: This field describes the maximum amount of seconds to wait for packet information from the remote device.
It basically means that the main device waits for this number of seconds before deciding if a packet has been lost or not. If the data from the remote device arrives before those number of seconds, the path measurement can account the packet loss, if any, and the two-way latency. This value must be at least as large as the worst-case latency between both measurement sites. Usually 3 seconds are more than enough but when the network in between can have a very long delay, you can increase the value. This will, however, use more main memory for the packet buffer.
-
Maximum original packet rate: This field defines the maximum packet rate that is to be expected. It directly defines the necessary amount of memory for storing packet information for the defined packet delay. The field can be left empty (or zero) to use the maximum supported packet rate of the device. This value usually only has to be adjusted if the debug information about Packets processed too early is non-zero, which indicates that the packet rate exceeded the assumed packet rate limit.
-
Ignore IP identification field: This option can be enabled if the IP identification field in the IPv4 header is modified by some component in the network. Often it remains constant for a single packet so this option should be left disabled as it will also increase the chance of reporting duplicate packets. But if you notice symmetrical packet loss you can enable this option to see if this helps.
-
Ignore checksum fields: This option can be enabled if the checksum in the IP header or TCP/UDP header is not correctly set. This often happens when checksum offloading is enabled and the packet is captured before it reaches the NIC for checksum calculation.
-
Ignore VLAN tags for connection matching: The path measurement only calculates loss and latency for connections seen on both devices. Usually the connection ID takes the IP pairs, port pairs and possible VLAN tags into account. If a VLAN is different on both machines for the some connection, then this option must be enabled to be able to correlate the connection and calculate correct statistics.
-
Account latency also per IP connection: Enabling this option will let the path measurement also store the latency for each individual IP connection, which of course increases the memory usage.
-
Enable NAT mode: This feature will enable support for Network-Address-Translation setup (typical for firewalls or internet uplink routers).
- NAT Private subnet/mask: This value describes the internal IP
addresses that get translated into an external IP address. An
example value is
192.168.1.0/24if all internal devices uses IP addresses in the range 192.168.1.0-192.168.1.255. - NAT Public subnet/mask: This value defines the external IP
address that internal IPs of the private subnet are translated to.
It can also be an IP subnet (for example, if multiple external IP
addresses are used). An example value is
10.1.2.3if the NAT router is using the external IP 10.1.2.3 and all its internal clients are visible under this IP. - Account unmatched flows: This option allows to monitor also connections, which are not seen on the other measurement side. This is useful to see blocked connections in firewall setups.
- NAT Private subnet/mask: This value describes the internal IP
addresses that get translated into an external IP address. An
example value is
-
Transfer time from measurement point: This option defines whether the transfer time of packets from the actual measurement point to the Allegro Network Multimeter is variable or equal time for each measurement point. Equal time allows for exact one-way latency measurements, usually available when running in bridge mode or when using network taps. If packets are received via port mirroring from remote switches, or via ERSPAN, the transfer time is usually not equal for each measurement point so one-way latency measurements are not possible in this setup.
The default value isVariable,Equalshould only be enabled if the transfer time is constant or below the minimum latency, as the one-way latency values include the transfer time as an additional uncertainty component. -
Delay threshold for hop determination: If more than one client is used, the system tries to determine the order in which packets traverse the measurement points. This automatic process can lead to wrong hop orders if the latency between measurement points is very small near the clock accuracy. This option allows to set an arbitrary value as a minimum measured delay needed to determine the hop order. Using the value zero uses the default delay internally. Typical values are between 10-100 (microseconds). The smallest possible value of 1 can be used in high-precision setups.
This value does not have any impact on the actual measurement values, it is only used to decide when a delay combination can be used to determine the hop order. -
Fixed hop order: To override the default automatic hop order calculation, a fixed order can also be entered with this option. The string is a comma-separated list of numbers, 0 being the main device, 1 being the first client device, 2 being the second client device and so.
An example value for 3 clients is0,1,2,3which means the order ismain device <-> 1st client device <-> 2nd client device <-> 3rd client device. -
Maximum packet length for lost packets PCAP: If a lost packet capture is running this setting configures the packet length for these packets. Keep this number as low as possible for optimal memory consumption. Each packet will be stored in memory until it is either confirmed by the client device (considered as not lost) or the maximum packet delay is over and the packet is considered lost and written to the PCAP.
-
Threshold for high latency packets PCAP: This is the threshold for a high latency PCAP. This is applied for single device measurement only. Packets with a larger time difference in their configured VLGs than this threshold can be captured. The latency value must not be larger than the maximum packet delay.
The settings must be saved but to actually take effect, a restart of the packet processing is necessary. If this step is required, a notification will tell so at the bottom of the page under Required actions.
Parameters currently in use
Section titled “Parameters currently in use”This section shows the current state of the measurement engine. The engine might be inactive even if the feature is enabled. Usually a restart is required to actually make it active. If active, the current packet delay is shown. It might be different from the selected value in the configuration above, but if so a note appears that a restart is required.
Required actions
Section titled “Required actions”An info box appears if a restart of the packet processing is required. The shown link leads to the page Settings → Administration, where the restart can be triggered. The device itself does not need to be rebooted, only the packet processing must be restarted, which usually takes only a few seconds.
Configuration PCAP measurement
Section titled “Configuration PCAP measurement”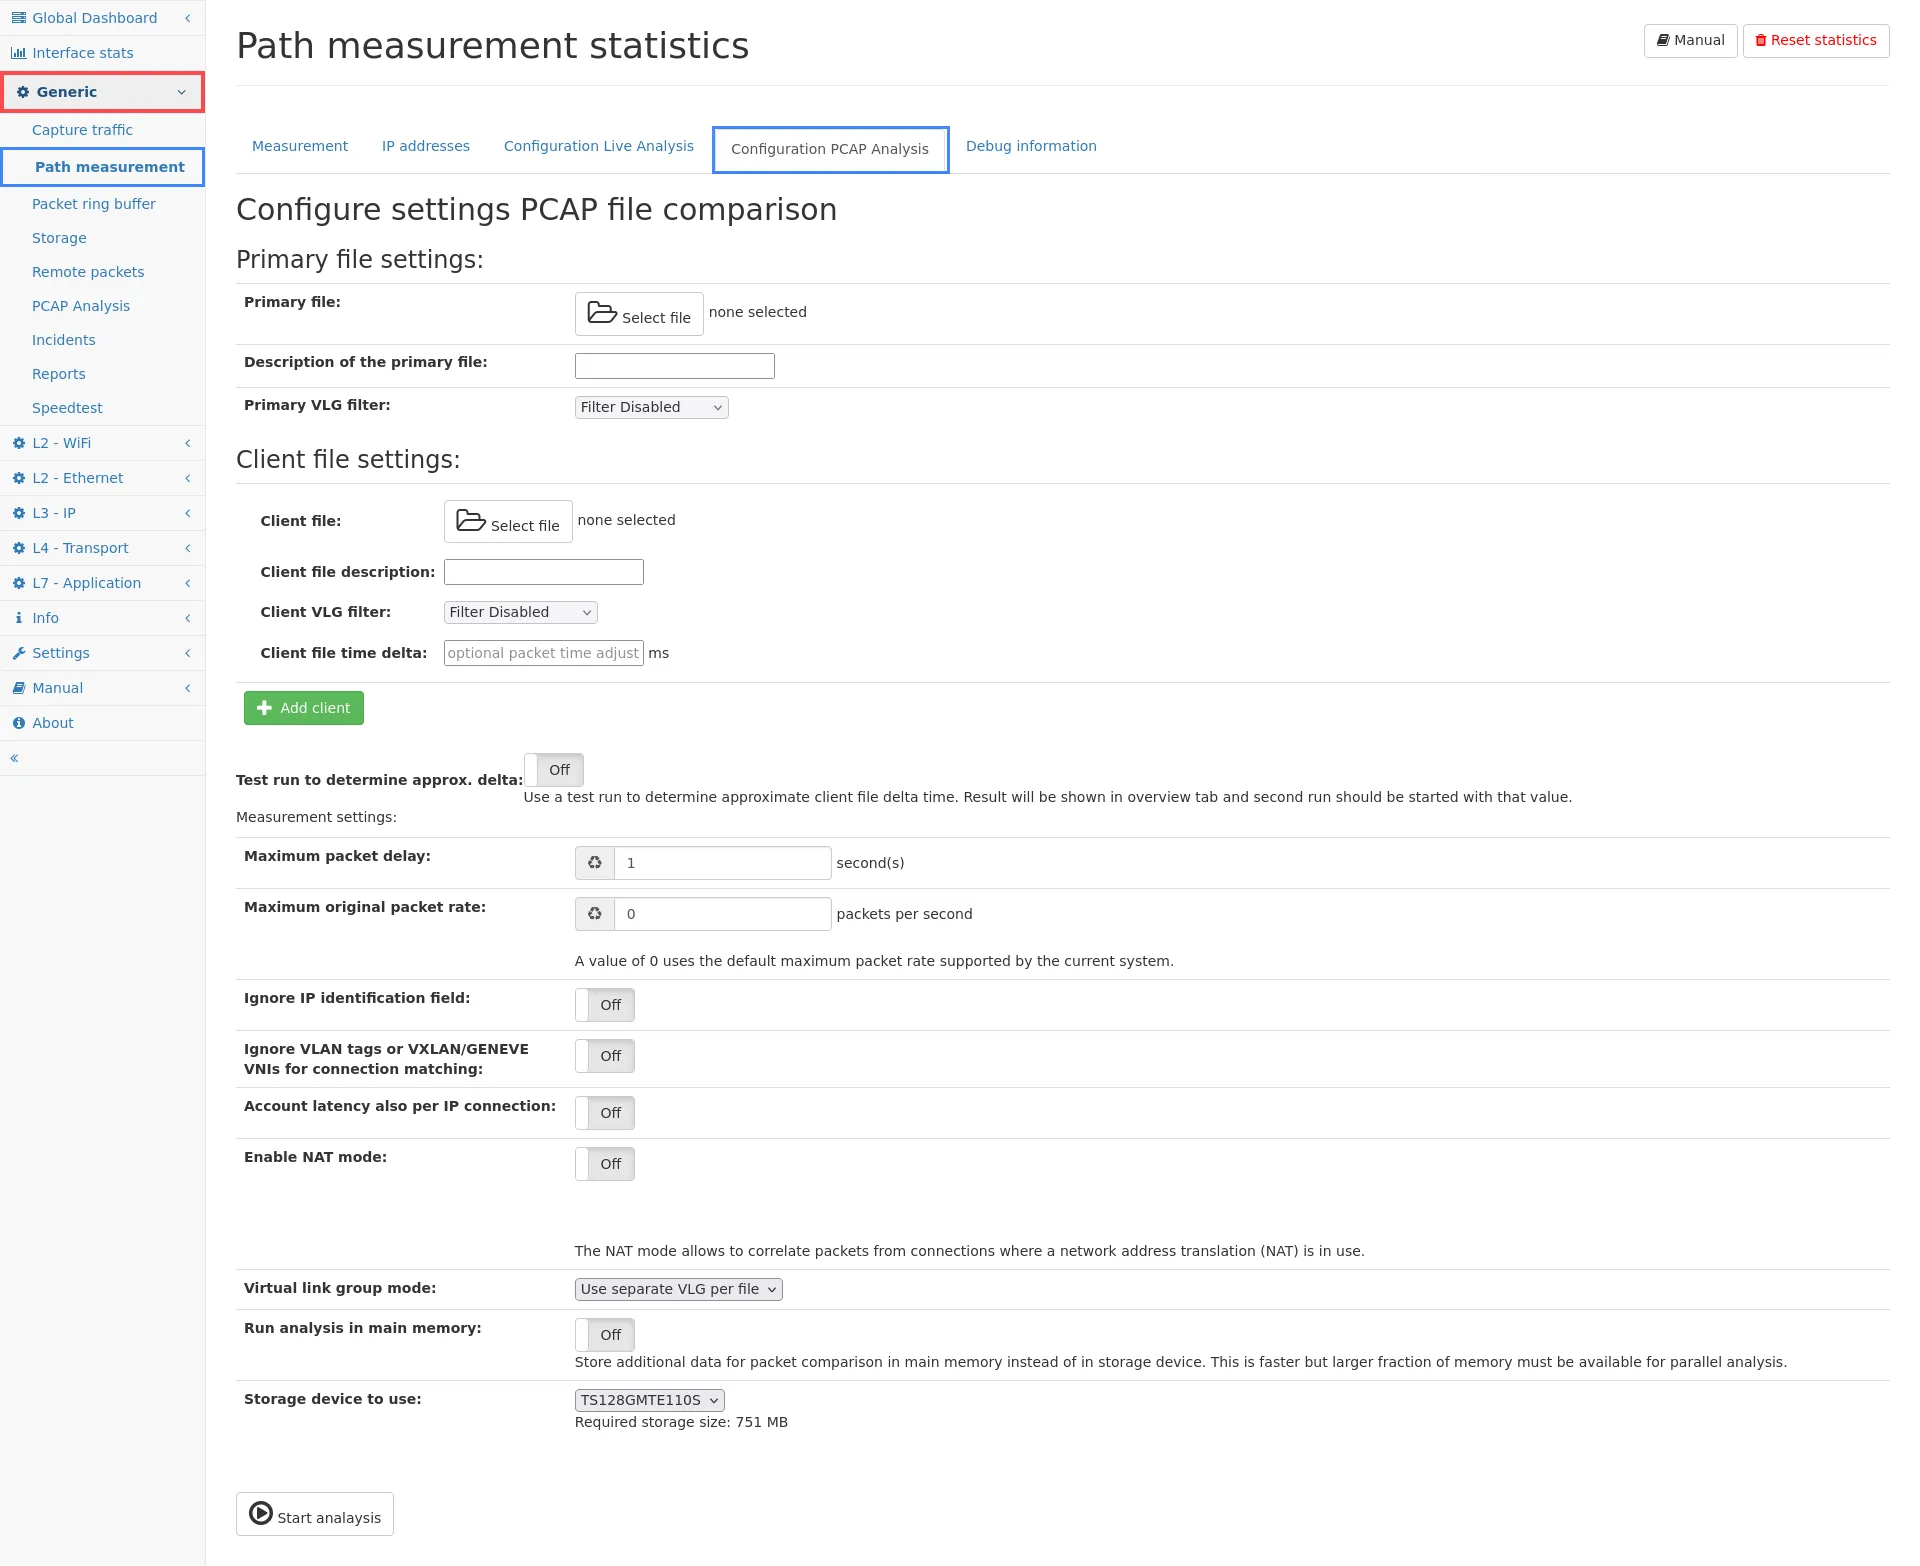
The path measurement can also be done based on capture files created from different network locations. The separate configuration tab Configuration PCAP Analysis allows to select up to eight files from attached storage devices.
The files are replayed based on the packet time stamps within each file, in chronological order. Matching packets are only recognized if they are within the maximum packet delay. If the difference of the timestamps is larger, a time-delta adjustment value can be entered which will be added to the timestamp of the client packets. Negative values are possible as well to be able to adjust the time in both directions. If the time difference is too large, a lot of packet loss are reported, or even a Network setup problem note is shown in the Overview tab. If the time delta between the files is not known, a test run can be enabled to calculate the approximate difference. When the files are fully processed in this test run, the result is shown in the Overview tab and this value can be used for the actual analysis.
The settings are similar to the live measurement. VLG filter can be applied to each file, but an option also allows to disable the use of the configured virtual link groups, or use separate groups for each file. In contrast to live mode, a VLG does not need to be used to differentiate traffic since it is clear from the selected file which one is the primary traffic and which one is the client traffic. But of course VLG can be used to filter out traffic that should not be part of the analysis.
The Measurement settings contains all settings from the live measurement plus three options only applicable in PCAP mode.
- Virtual link group mode: Select to either:
- Use global VLG settings: Use the VLG configuration configured globally on this device.
- Use separate VLG per file: Create a temporary VLG for each file so all statistics can be accessed for each individual file regardless of the configuration of the regular virtual link groups. This is the default value as it makes comparing other statistics easier. Just switch between the VLG for each file in any statistics view to see the relevant values for the given file.
- Disable use of VLGs: Disable all VLG configurations and use one common view of all data.
- Show one-way latencies: This option can be used if the PCAP
files are guaranteed to be time-synchronized. The measurement will
show one-way latencies but consider that any time drift/delay will
be included in those latency values. With this option disabled,
the time difference will be compensated for the two-way latency.
If this option is enabled, the overview page shows the minimum/average/maximum time deltas seen between any matching packet. This helps to get an indication about the accuracy of the shown one-way latencies. - Run analysis in main memory: The analysis requires a relatively large amount of memory depending on the setting values for packet delay and packet rate. In live mode, this data is always kept in main memory for performance reasons, but in PCAP mode the data is stored on a local storage device by default. This is slower but does not require a lot of additional memory reserved, especially when parallel PCAP analysis is enabled.
- Storage device to use: If a storage device is available, the first one is selected by default. Otherwise the system disc is used to store the packet comparison information. The approximate amount of storage space required is shown below the selection box.
Measurement statistics
Section titled “Measurement statistics”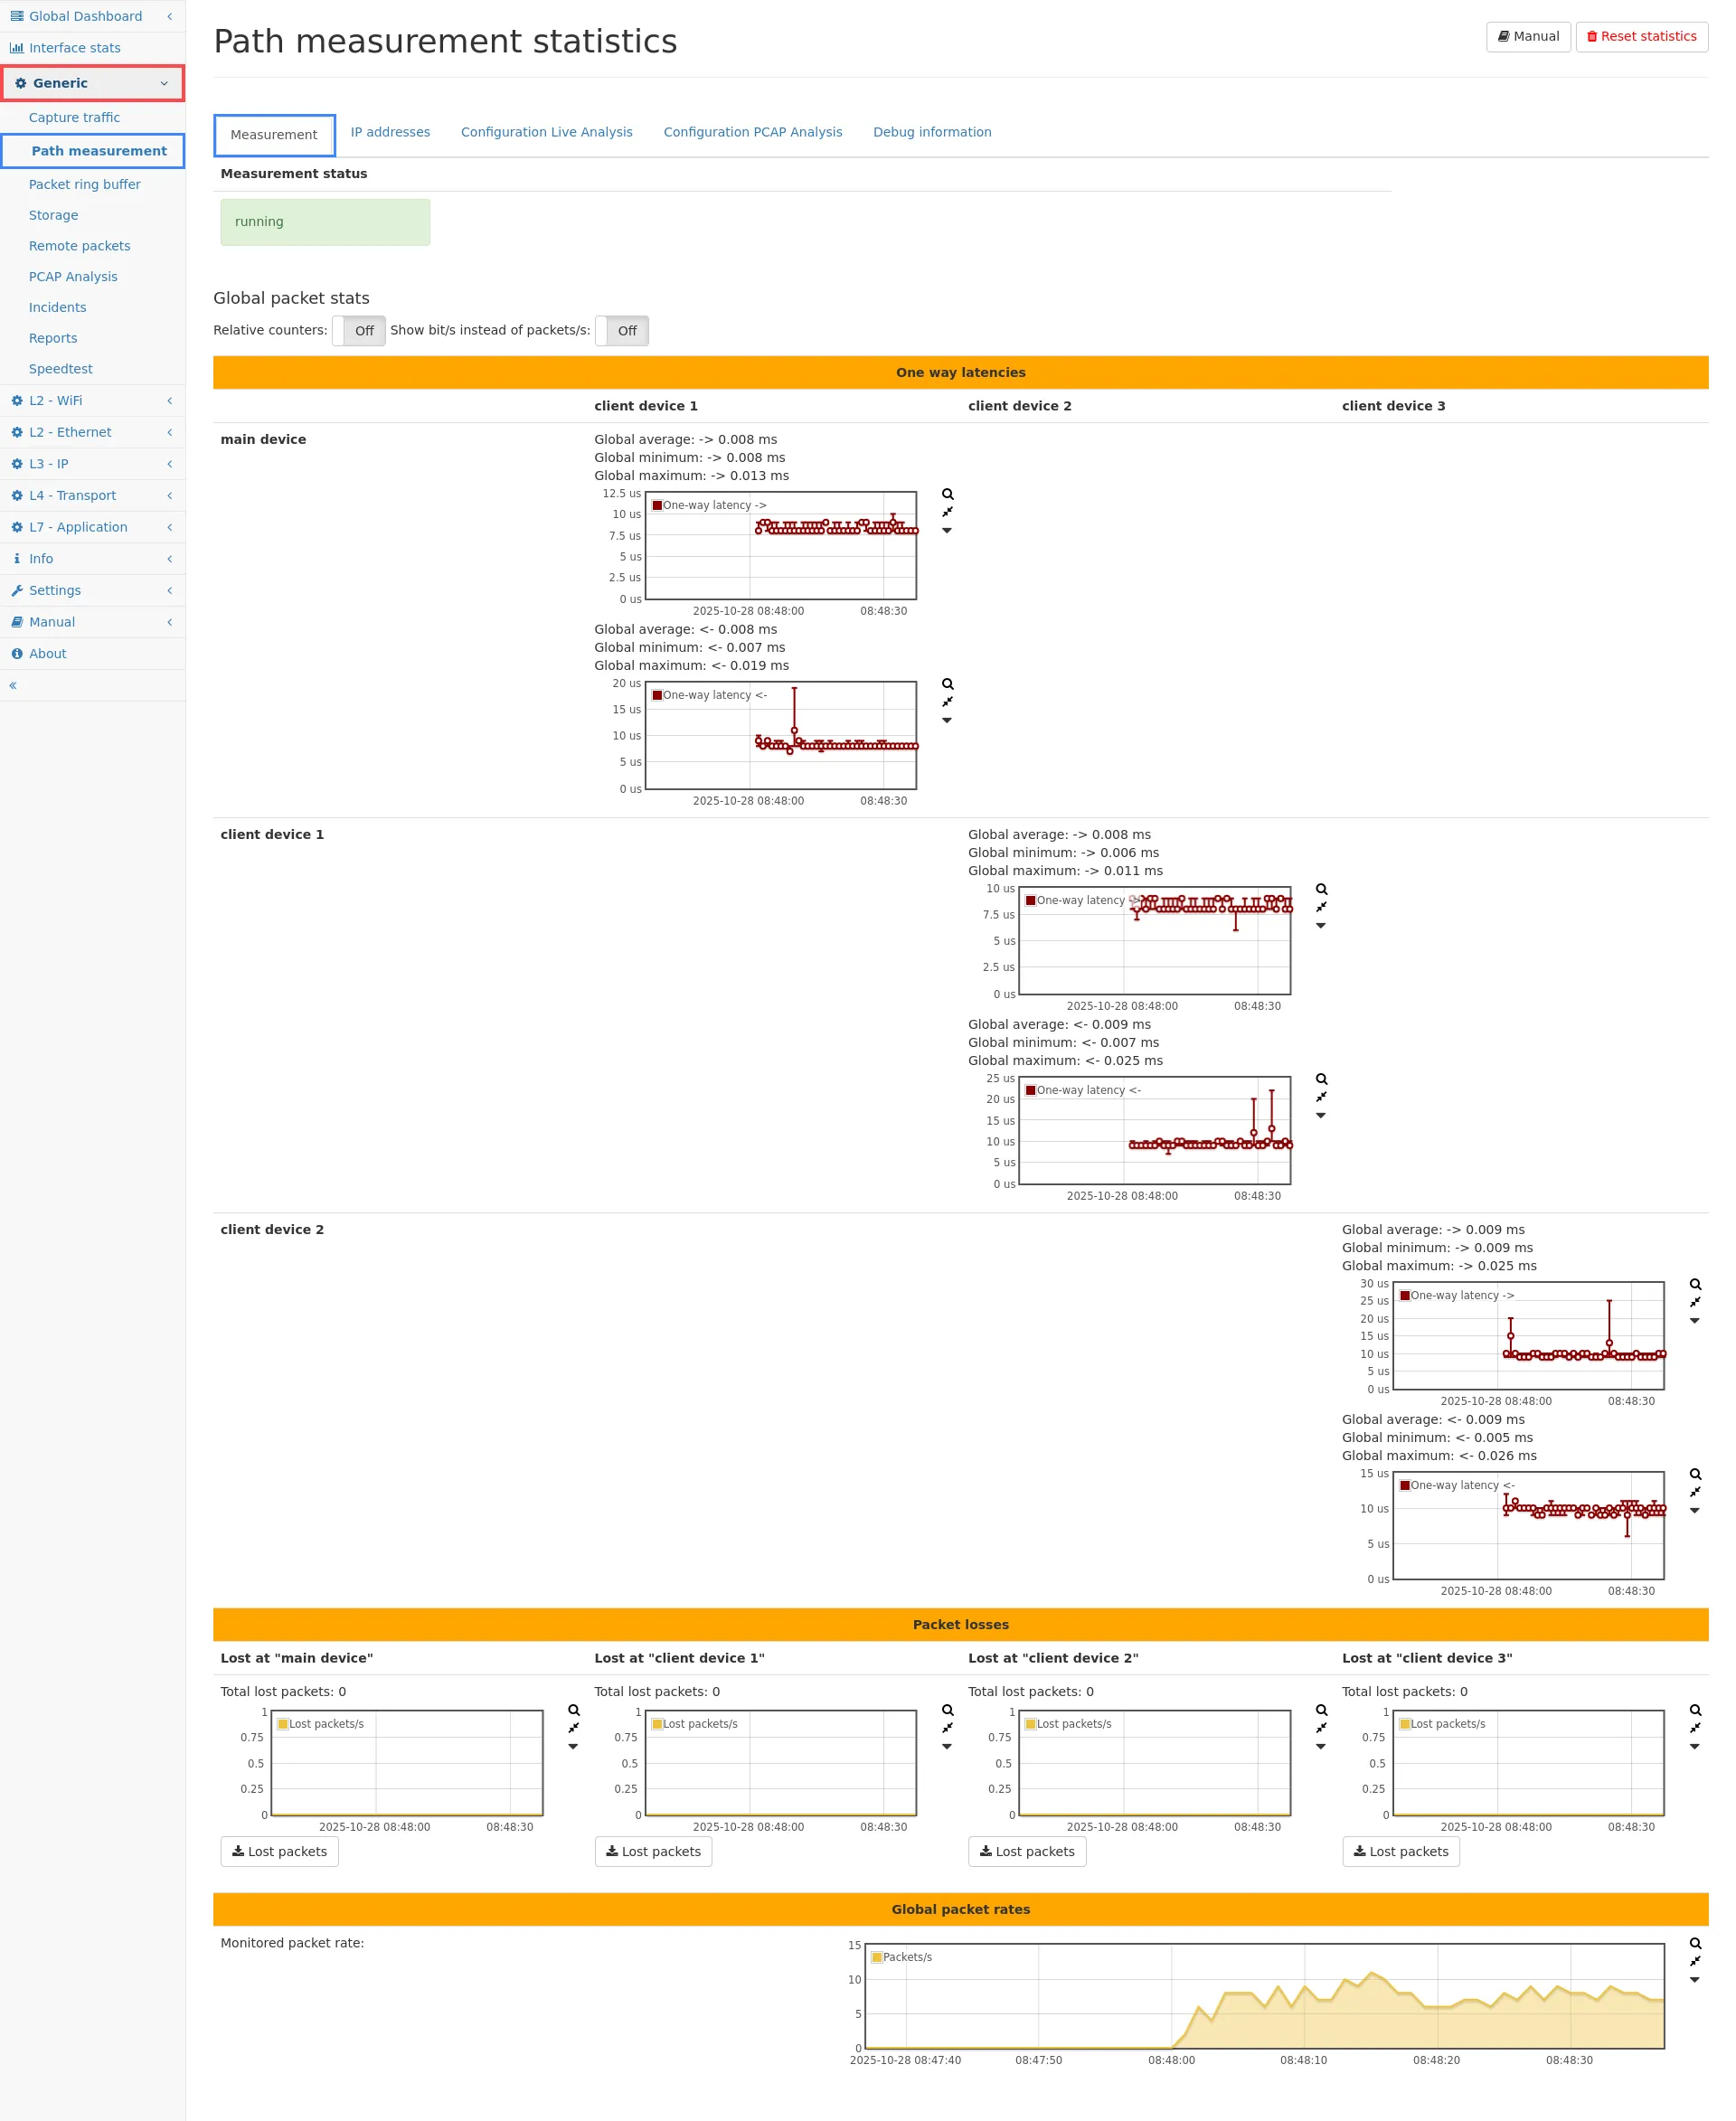
Measurement
Section titled “Measurement”The measurement tab shows the real-time results of the ongoing measurement. At the top the current state of the measurement engine and the remote connections is shown. The measurement status can be not running if it is disabled, warming up if the engine waits for synchronization with remote device, and running if it actually measures data. The remote client status indicates if the connection to the remote device is established. Since the packet information are gathered via regular capturing from the remote device, the capture connection is visible in the capture section of the remote device and might be stopped there. If the measurement connection is stopped or stopped working for other reasons (remote device unavailable, etc), the status box will turn red and a button appears to reconnect to the remote device. If the reconnect fails, an error message appears with detailed information what was going wrong.
Typical errors are:
- Remote device inaccessible (are the IP and port settings correct?).
- Authentication error (invalid credentials?): When both boxes are green, the measurement is running and the four graphs show the real-time results.
- Insufficient memory: Usually may only appear in PCAP analysis mode indicating that the values for packet delay and packet rate are too large. Either reduce the values or use a larger storage device capable of storing the required data (amount shown in the configuration section).
Two-Way-Latency
Section titled “Two-Way-Latency”The first section shows the latency measured between all configured devices (main device between multiple VLGs, or main device and remote devices). It cannot (due to asynchronous local time sources) measure the one-way latency of a single packet but only the duration of packets going in both directions. Example: Assume a packet A is seen from main to remote device and another packet B is seen from remote to main device. The time difference when packet A is seen on main and on remote device plus the time difference of packet B being seen on remote and main device is taken into account to determine the two-way latency. Packet A and packet B do not need to be related in any way. If traffic is going only in one direction, the measurement will not show any time result (even though packet loss is still visible). For each second, the average, minimum, and maximum two-way-latency are accounted and shown in the graph. To the left of the graph the statistics for the visible time range are shown, changing the zoom level or time interval will update the values accordingly.
One-Way-Latency
Section titled “One-Way-Latency”The Allegro Network Multimeter can also calculate one-way latencies if the following conditions are fulfilled. In normal mode for two-way latency, the time difference between the measurement devices is compensated to calculate the sum of latency for both directions. In one-way latency mode, the latency is calculated for each direction separately based on the synchronized clocks. This requires the following conditions:
- Measurement setup:
- Measurement is done completely on a single device (by selecting the primary device as client devices too) OR
- The main device and all remote client devices are time-synchronized via a GNSS clock source.
- The option “Transfer time from measurement point” is set to “Equal”. This means that the duration from the actual measurement point (a switch or preferable a TAP) is equally large for each client and does not influence the latency.
When these conditions are fulfilled, the one-way latency is shown for each direction instead of the two-way-latency. PCAP buttons are available for a capture of high latency packets that exceed the configured threshold.
Lost packets
Section titled “Lost packets”The second section shows the number of lost packets on each device. Lost packets are only accounted for connections that have been seen on at least two devices.
Depending on the installation point and routing setup, connections might not be routed to the second device on purpose. These connections are not accounted as loss on the other device.
An additional counter Client packet drop due to overload indicates if some packets could not have been captured on the client device, so they are missing for comparison at the main device. If this value is not zero, those packets are accounted as packet loss even though it might not be actually losses. For correct measurements, make sure the graph for remote packet drops is never non-zero. These drops may happen due to several reasons:
- System capture overload: If multiple captures are running in parallel, the CPU might be overloaded. Check the All tab in the Capture page to see how many captures are running. In best case there is only the one capturing connection to the main device.
- The capturing connection is encrypted with TLS. The smallest model Allegro 200 has a limited encryption capacity, so for high traffic rates this can be a bottleneck. The only solution is to use a more powerful Allegro Network Multimeter.
- Capture drops can also occur if the network connection is not capable of transferring the data fast enough. Rule of thumb is that approximately 5% of the total traffic is used for the measurement connection. For example, if the traffic is 500 MBit/s, the measurement requires ~25 MBit/s of bandwidth on the management port.
A capture button for lost packets is available for capturing packets seen on main device but considered as lost on the remote device. The capture is available for live mode only, i.e. if a time interval is selected in the Allegro Network Multimeter it will be ignored. When starting the capture, the path measurement engine will store all packets on the main device with the configured length and write them after the packet delay timeout into the PCAP. Only packets of the main device are considered (packets lost on main device but seen on remote device will not be captured). For a single device measurement between different VLGs the Lost packets PCAP buttons are available for both directions (main to remote or remote to main).
Monitored packet rate
Section titled “Monitored packet rate”This section shows all packets that are monitored for the path measurement. It will cover all connections that have been seen on at least two devices.
NAT collision packet rate
Section titled “NAT collision packet rate”This graph shows the number of packets per second that appeared in connections with colliding IP addresses/ports in NAT setups. This happens if matching packets are seen on both sides for more than two connections (the internal and the external connection). Since this is only relevant for matching packets within the defined timeout, it may help to reduce the timeout if possible.
Switching graph modes
Section titled “Switching graph modes”The toggle buttons above the graphs allow to switch the graph modes from absolute values to relative values. This setting will show the lost packets in relation to the total (monitored) traffic. The second option allows to show Mbit/s throughput instead of the packet rate.
IP addresses
Section titled “IP addresses”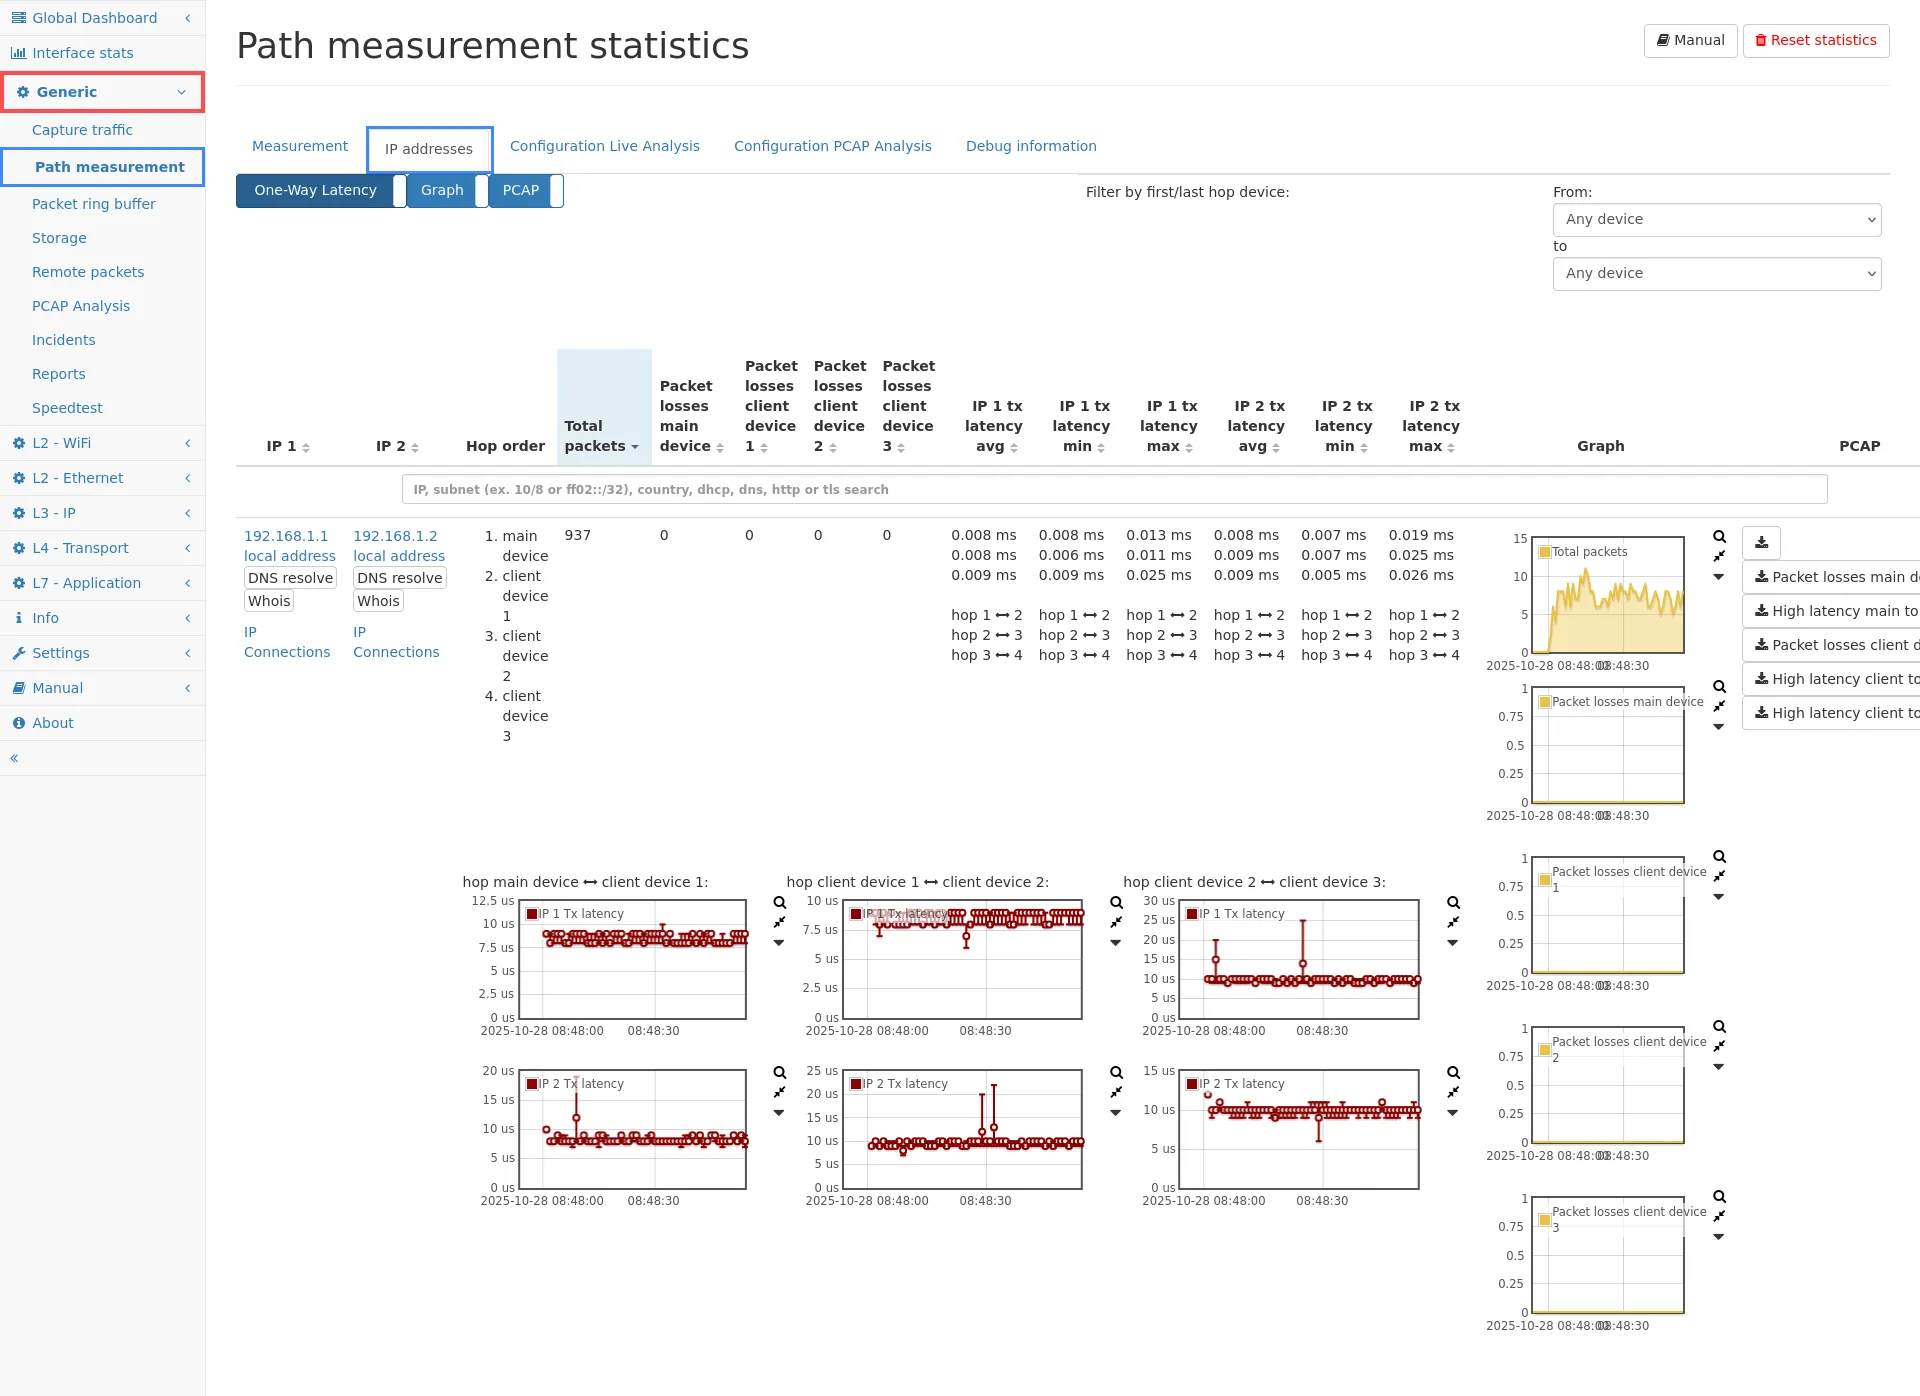
The second tab shows packet loss information for each pair of IP addresses. This statistic covers all IP connections that have been seen on some measurement sides. The table shows the number of packets that have been counted for each communication pair. Additionally the number of packets seen on the main device and the corresponding packet loss is shown. The same statistics are shown for the client device too.
With more than one client device, IP pairs can appear on multiple measurement points, creating a hop chain which is shown in the Hop order column. For each such hop, the latencies on that hop are shown separately in the corresponding latency columns. Underneath the numerical values, latency graphs are shown for each hop.
You can click on the IP address to go to the detailed statistics of the IP module to check which kind of traffic was happening for that IP. Graphs are shown for each IP pair which shows the packet loss on each hop in one graph and the total packets in another graph. There is also a capture button to capture traffic for the IP pair. The captured traffic is only the traffic seen on the main device, it will not contain any packet from remote client devices as the main device does not have the packet data information available. To capture traffic from the client device, you have to go to the web interface of the client device and start a capture on that device.
The IP pair table also shows the two-way latencies for the traffic of each IP pair, if the corresponding toggle is selected above the table. In single-device mode, also the one-way latency is shown.
For each IP, there is also a link to the IP connections. If enabled, each individual IP connection also stores the latencies for more detailed view.
IP connection details
Section titled “IP connection details”If the option to store measurement info on connections is enabled, the latency informations are also available for connections. The IP pair table contains links to the actual connection list of the IPs. In the connection table, the latency columns can be enabled and latency graphs can be selected via the graph selection menu.
The individual connection detail page also contains all path measurement information for that connection.
Keep in mind, that the information are only available on the Virtual Link Group of the main device, not of the remote devices. Make sure to select the correct VLG in the selection menu in the top menu bar.
If all clients are local, the information is still stored only on one of the connections visible in all VLGs (to safe memory). In this case, the connection detail page will either show the available information, or give a hint on which VLG the information are accessible.
Limitations
Section titled “Limitations”There are some limitations about the path measurement:
- Due to technical reasons, large clock adjustments cannot be filtered out. So in such cases, a very large two-way-latency is measured. Both devices need not be time synchronized per se, however, considerable time differentiation must be avoided. This means that time synchronization (e.g. NTP/PTP) should either be enabled or disabled on all devices for best results. Clock differentiation miss-measurements are however one-time events, and will not lead to false values for the following packets.
- The maximum supported packet size for the path measurement is currently 2048 bytes. Larger packets are truncated for the measurement.
- WAN optimizer and similar devices which rewrite some of the traffic are not supported. If packet data is changed (like modifying the TCP header, adding TCP options, etc) the flow will account packet loss on both sides as the original packets are not seen on the other side. If the device in between also modifies the IP addresses or ports, the flows will be accounted as unmonitored.
- The global setting for the packet length accounting should be set to the same value on both devices. Otherwise identical packets might be considered different because of different length and the bandwidth information will be inconsistent.
- In NAT mode, the NAT resolution is only done between the main device and the selected client devices.
Typical use cases
Section titled “Typical use cases”See Analyze connections between remote sites to get a detailed overview of use cases and device setup.
Debug information
Section titled “Debug information”The Debug information tab shows additional statistics which are usually only relevant for identifying problems in the path measurement, either program errors or test setup errors.
Flows seen
Section titled “Flows seen”The first sections informs about the amount of IP connections monitored on the path measurement devices.
- Monitored flows seen on at least two devices: The monitored flows describes all IPv4 and IPv6 connections that have been seen on at least two devices and are used for calculating the latency and packet loss. Only this traffic can be considered for the actual measurement. In a working setup, the value must be non-zero.
- Flows seen on at least two devices without matching packets: If a flow is seen on two devices but not a single packet matches on both sides, it indicates a potential network setup problem. This probably means the packet is somehow modified by a device in between both measurement points. This setup is not supported. Usually this value should be zero. Small non-zero values can be ok, if the first number of monitored flows is much larger.
- Unmonitored flows seen only on “<main device>”: This counter shows the number of IP connections that are only visible at the main device. It means that for those connections no matching client packet has been received. If the main device also sees network traffic that is not routed to the client device, this value can be non-zero.
- Unmonitored flows seen only on “<client device>”: This is the same counter as for the main device, but counting the connections on the client device that have not been seen on the main. Again, if the client device sees traffic that is not routed to the main, it is fine to see non-zero values here.
Possible problematic scenarios
Section titled “Possible problematic scenarios”-
There is a device between main and client that modifies the traffic (like a WAN optimizer): You will notice a larger value for counter 2 (flow without matching packets), almost zero value for counter 1 (flows seen on both devices).
-
There is a device between main and client that changes ports and IP addresses (a NAT): You will notice almost zero values for counter 1 and 2, but high values for the other counters.
Both scenarios are not supported by the path measurement. Please adjust the test setup to disable any device modifying the network as described above.
Packets seen
Section titled “Packets seen”The second table shows the following counters for the main and each individual client device:
- Packets seen on all devices: These counters measure the total amount of packets monitored and considered for the analysis.
- Packets seen only on device: For each device, this counter indicates how much packets are lost on the other devices.
- Duplicated packets: This counter includes packets that are duplicated or have the same checksum. It is valid to see non-zero values here. Some protocols like broadcast actually do not differ in the payload so the packet checksum will be identical. If those packets appear within the packet delay time window, it is accounted as a duplicate to the previous one.
- Failed to process on “<main device>”: This counter indicates that packets from the client have been discarded due to overload of the main device. The main device was not fast enough to process client packets. This usually means the local packet rate (at the main device) is too high.
- Ignored on “<main device>”: These packets are ignored because the flow is unknown to the main device. This happens when the packet checksum is received from the client but no connection information for that packet is known by the main device. This value should always be zero. Otherwise it means that the number of active flows is too high.
- Packets processed too early: This counter covers packets that could not be stored long enough to hit the configured packet delay limit. This happens when the packet rate is higher than the supported packet rate of the main device.
- NAT collision packets: This counter counts all packets that are seen on both sides for multiple connections so the Network Address Translation could not be reversed for connection tracking.
Time drift
Section titled “Time drift”Below the table, graphs show the time drift information for each client. The graph on the left shows the packet delay. It is the time between a matching packet from the main device and the client. This value describes for how long the main device needed to wait to get a matching packet from the client. This value should always be much lower than the maximum packet delay configured in the path measurement configuration. The value cannot be larger than the maximum, as then packets can no longer be matched. If the value keeps reaching the maximum, two problems are possible:
- The delay between main device and client is large due to generic network delay. For example, if a high-latency connection is used for path measurement, it can even take a few seconds for a packet info to arrive. Configure a larger maximum packet delay.
- The bandwidth of the connection from the client (the client’s upload speed) is too small to satisfy the requirement for the checksum connection. This problem can be identified if even increasing the maximum packet delay does not help. If the bandwidth is too small, the packet will hit the maximum delay for any value configured, it will just take a little longer.
In this case try to use an alternative network connection to connect to the client device.
The second graph at the right shows the time drift between the main device and client device. Usually there will always be a drift between the clocks of both devices (if they are not synchronized by some mean). Even large drifts (hours, days, etc) are typically not a problem as the two-way latency zero-outs the drift. But if the drift increased dramatically (like multiple seconds) constantly over a large period of time, it usually indicates a bandwidth overload just like the first graph.
What does the note Network setup problem detected: Packet modification or complete loss mean?
This message box appears if flows have been identified for which not a single packet could be seen on both sides. Usually this means that there is some device in between both measurement points that modifies the packet.
This can be WAN optimizer, which rewrite TCP connections for improved network performance. Such setup is not supported.
It can also mean that some other packet field is modified at some point in the network. One field that is known for modification is the IP identification field in the IPv4 header. For this case an additional option can be enabled to ignore this field.
When using the PCAP analysis mode, this error can also appear if the files are not time synchronized. In this case, a time adjustment value must be entered to synchronize both files. A test run can be performed to calculate a possible value.
What does the note VLAN tag mismatch detected for matching packets on main device and client mean?
This message indicates that matching packets have been seen on both devices but the used VLAN tag is different. Depending on the measurement setup, this may indicate an error as for connection matching the IP addresses, ports, and VLAN tags are used unless the option to ignore the VLAN tag is enabled. Therefore, the identical packets will be accounted for two different connections often resulting in shown packet loss. Often, the recommended solution is to enable the configuration option Ignore VLAN tags for connection matching.
What kind of packet information is used to determine latency and packet loss?
Both measurement devices calculate checksums starting from the layer 3 packet data to compare packet information on both sides. This means for IPv4 and IPv6 traffic, the Ethernet header including possible VLAN tags is ignored. For non-IP traffic, the complete layer 2 packet is used, so this traffic can only be analyzed in switched networks.
What can I do if I think the packet loss is wrong?
Often, incorrect loss is reported because there is some kind of packet modification that is not supported. See the list of limitations above if any of those apply to your setup. Also, try the configuration options to ignore some packet fields to see if that makes any difference. You can contact Allegro Packets support and if possible provide a small capture from both network sides that cover the same traffic. This will help us to find the reason for the shown packet loss.
How can I distinguish between real packet loss and reported packet loss due to packet modifications?
Packet loss is reported when a packet checksum does not match any other checksum reported by the other side within the configured maximum packet delay timeout. Reasons for such an event are:
-
Actual loss: The packet has been seen on one side but not the other. In this event the loss graph is usually different between the main device and remote device.
-
Packet modification: Some component modifies the packet in some way. Since such a modification is usually done in both directions (sender and receiver), the packet loss is visible on both sides. Therefore the loss graph is symmetrical.
-
Overloaded management connection: The management connection is used to get packet checksums from the remote device. If the connection is not fast enough to transmit the checksums within the configured maximum packet delay time, the packets are then reported as loss. This can be verified by looking at the debug graph Packet delay between local and remote packets. In this event, the time will always be at the top limit that is the maximum packet delay time.
-
Temporary network failure: In this event the packets are really lost on both directions so the loss graph may also look similar. However, since no packet can be transmitted to the other side, you will also see no entries in the two-way-latency graph.
How is the two-way latency calculated?
The system monitors individual IP connections and stores the time difference between the occurrence of the same checksum on both the main and client devices. Since this time difference contains the unknown time drift between both systems, it cannot be used directly as a latency value. Instead, the system waits until a packet from the opposite direction has been seen on both systems. Both time differences for direction A→B and B→A build the actual two-way latency. Since both packets may not be directly related, it is not directly comparable with a round-trip time. It gives however an accurate view on how long data took transmitting back and forth during each individual time segment.