Profinet module
PROFINET is an open Industrial Ethernet communication protocol, based on international standards. It is designed to exchange data between controllers and devices, mostly in manufacturing and/or automation environments. Since its introduction in the early 2000s, it has grown to become the most well-adopted Industrial Ethernet solution.
Allegro Network Multimeter facilitates highly granular PROFINET monitoring and PROFINET troubleshooting in real-time and back in time. Packet-based analysis and statistics are available for communication relations, top talkers, bandwidth consumption, jitter, frames, PROFINET errors and alarms (PN-RT, PN-RTA and PNIO-CM).
Allegro Packets’ incident engine allows for automatic reporting of PROFINET alarms and threshold based triggers to various configurable channels. Also PROFINET traffic recording and automated event-based PROFINET packet capturing is readily available to you in Allegro Network Multimeter.
Global PROFINET statistics
Section titled “Global PROFINET statistics”Overview
Section titled “Overview”The Overview tab is the global information dashboard revolving PROFINET traffic.
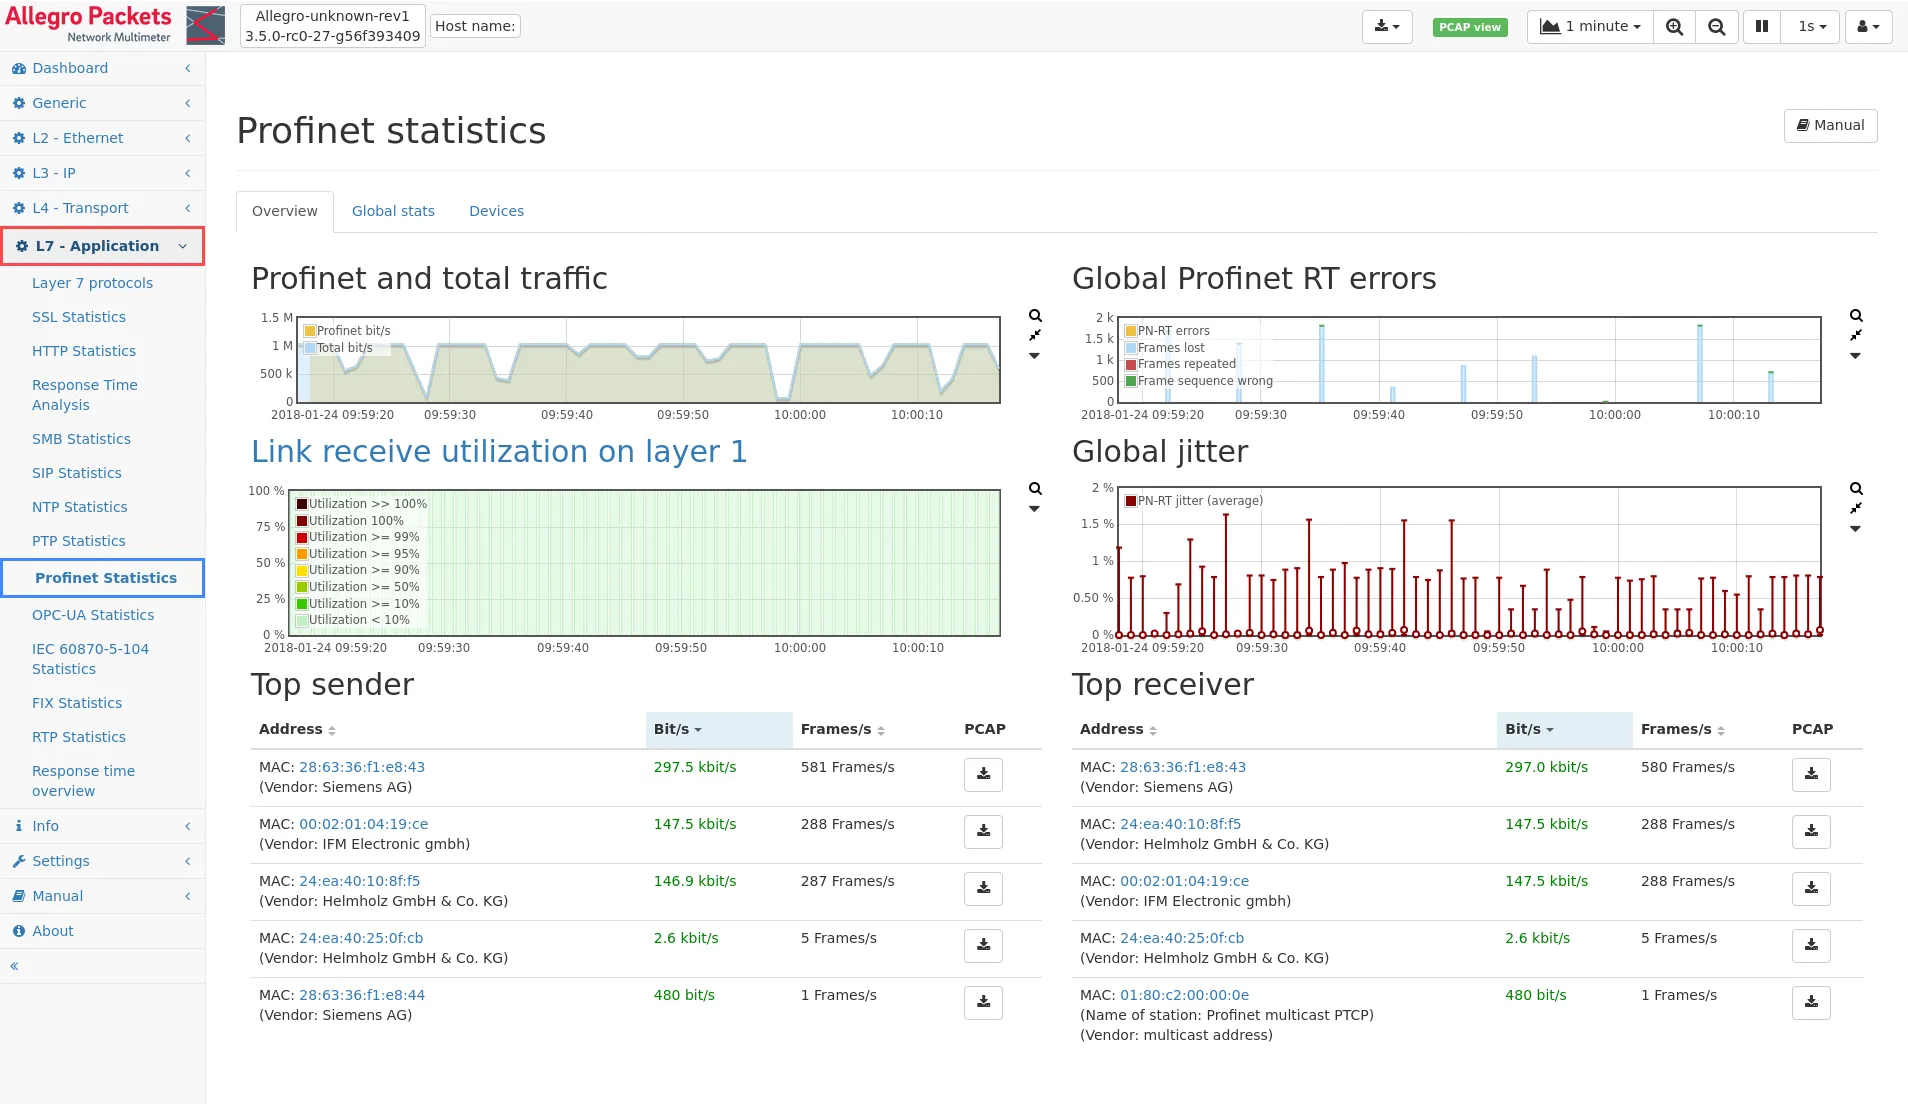
These shown graphs and tables depict:
- PROFINET traffic in relation to total traffic.
- Global PROFINET PN-RT errors.
- Millisecond micro burst analysis.
- Global PROFINET jitter.
- The top 5 PROFINET senders and receivers.
Whenever graphs depict anomalies such as high loads, RT-errors and/or high jitter, these instances can be zoomed into by selecting (click and drag) a spike in the graph with the mouse.
The top talker tables are sortable by address, byte or frame count. The download button at the end of each device line provides you with a pre-filtered PCAP, containing only the conversations from that specific address during the selected time interval. Both, forward capturing in real-time, as well as retroactive packet extraction from an active ring buffer, are possible.
Global stats
Section titled “Global stats”The Global stats tab provides you with detailed statistics and a summary for a specific/selected time interval.
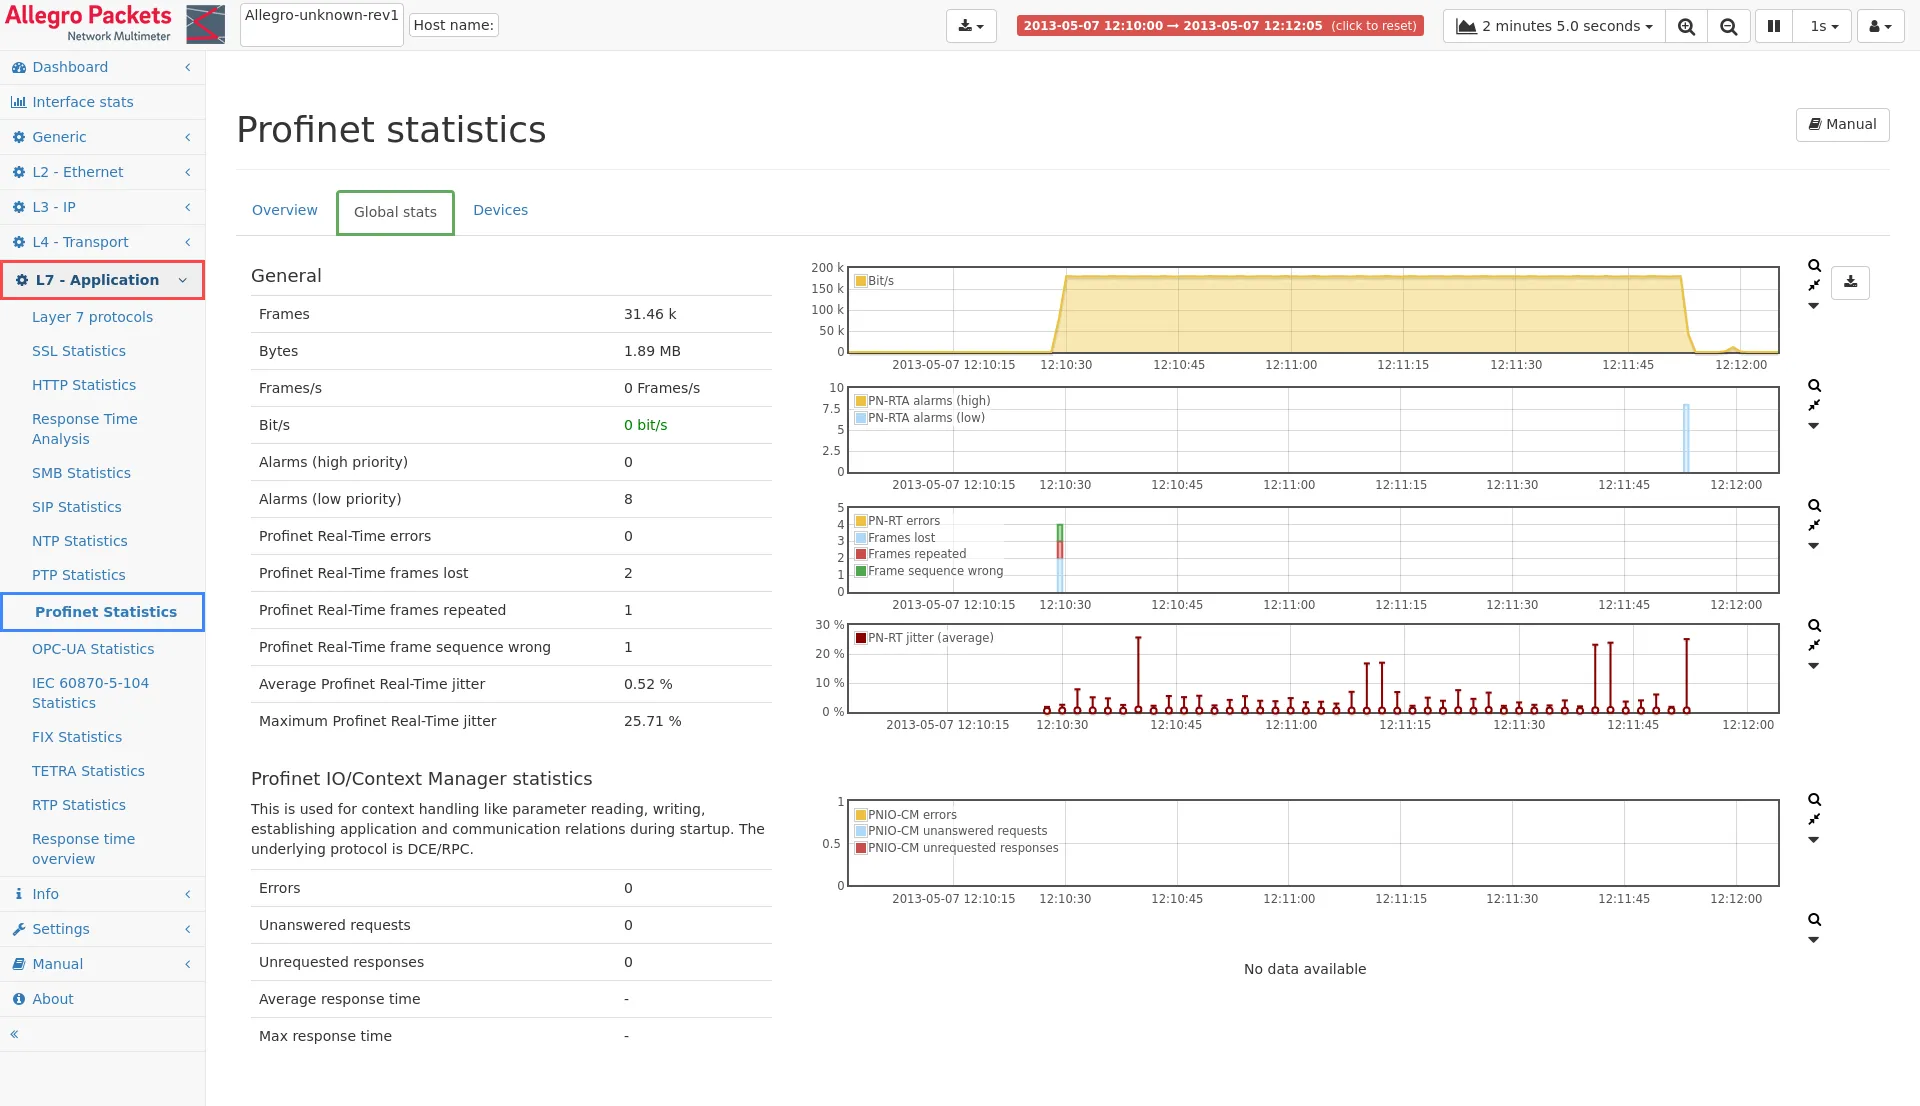
The (time interval) information for the overall PROFINET traffic shown on this page includes:
- Total PROFINET bytes and frames count.
- Total PROFINET alarms and errors count.
- Average and maximum PROFINET jitter.
- PROFINET unanswered request count.
- PROFINET unrequested response count.
- PROFINET response time information.
Whenever graphs depict anomalies, such as high loads, RT-errors, alarms and/or high jitter, these instances can be zoomed into by selecting a spike in the graph with the mouse (click and drag). This not only helps narrow down the timeframe to troubleshoot, it also results in the most optimized pre-filtered PCAP files with PROFINET traffic, if those are needed.
Devices
Section titled “Devices”The global Devices tab lists all seen PROFINET devices or controllers. You can sort all data and statistics displayed in the columns, for instance to quickly find the device with the highest jitter, the most errors, alarms or most traffic.
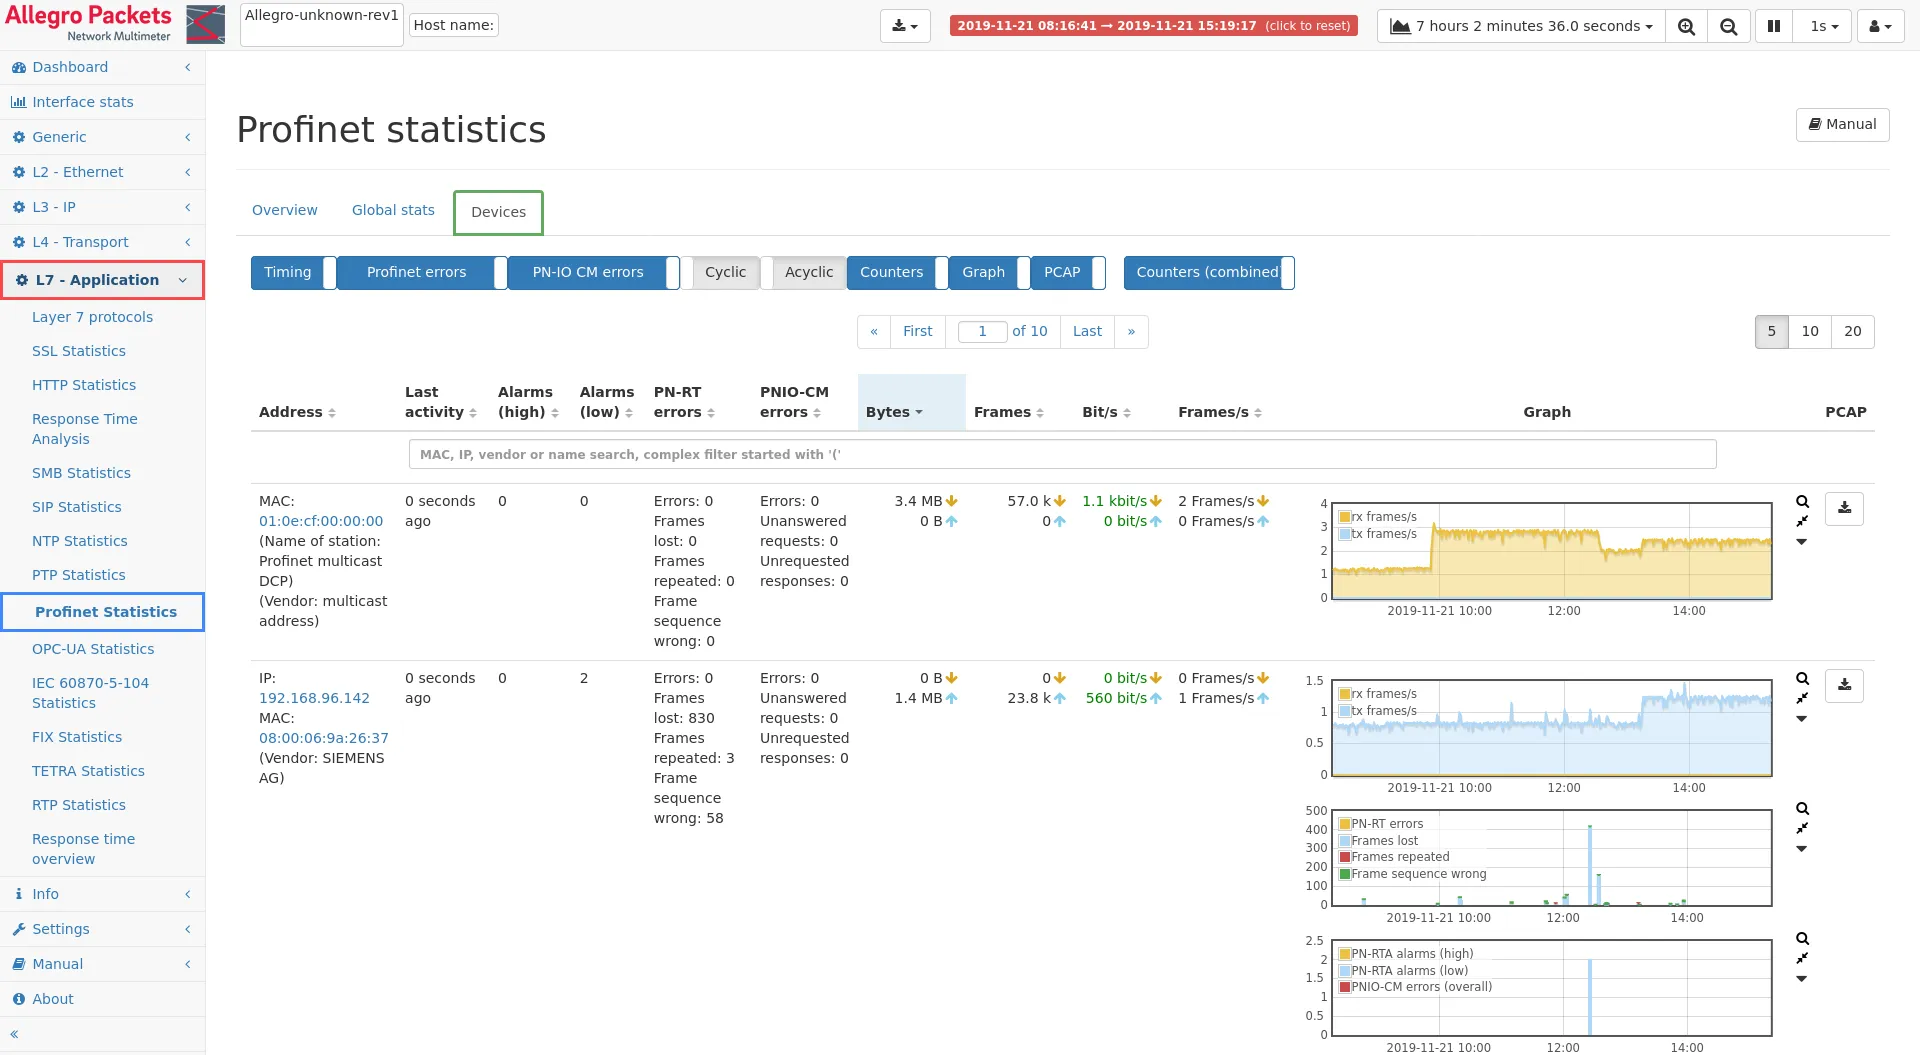
The search bar allows to enter MAC, IP or vendor name to easily filter
and depict only the elements matching your search criteria. Also complex
filter expressions may be used in the search bar. Such complex filter is
initiated by starting a search string with an open parenthesis (.
See Live filtering of
tables for a
detailed description about how to use this feature.
Whenever graphs depict anomalies such as high loads, RT-errors, alarms and/or high jitter, these instances can be zoomed into by selecting a spike in the graph with the mouse (click and drag). This not only helps narrow down the timeframe to troubleshoot, it also results in the most optimized pre-filtered PCAP files with PROFINET traffic per MAC/IP, if those are needed.
The download buttons on the far right, provide you with such a pre-filtered PCAP. It will only contain the conversations from that specific IP/MAC during the selected time interval. Both, forward capturing in real-time, as well as retroactive packet extraction from an active ring buffer, are possible.
When clicking on a MAC or IP address of a PROFINET device in the address table, a very detailed summary page for that particular device is shown. The resulting page will be further explained below.
Statistics for PROFINET device
Section titled “Statistics for PROFINET device”Overview
Section titled “Overview”The statistics page of the individual PROFINET device can be accessed by clicking on MACs or IPs listed on the main/global PROFINET statistics pages. The Overview page provides you with extensive details for that device, in the specific/selected time interval.
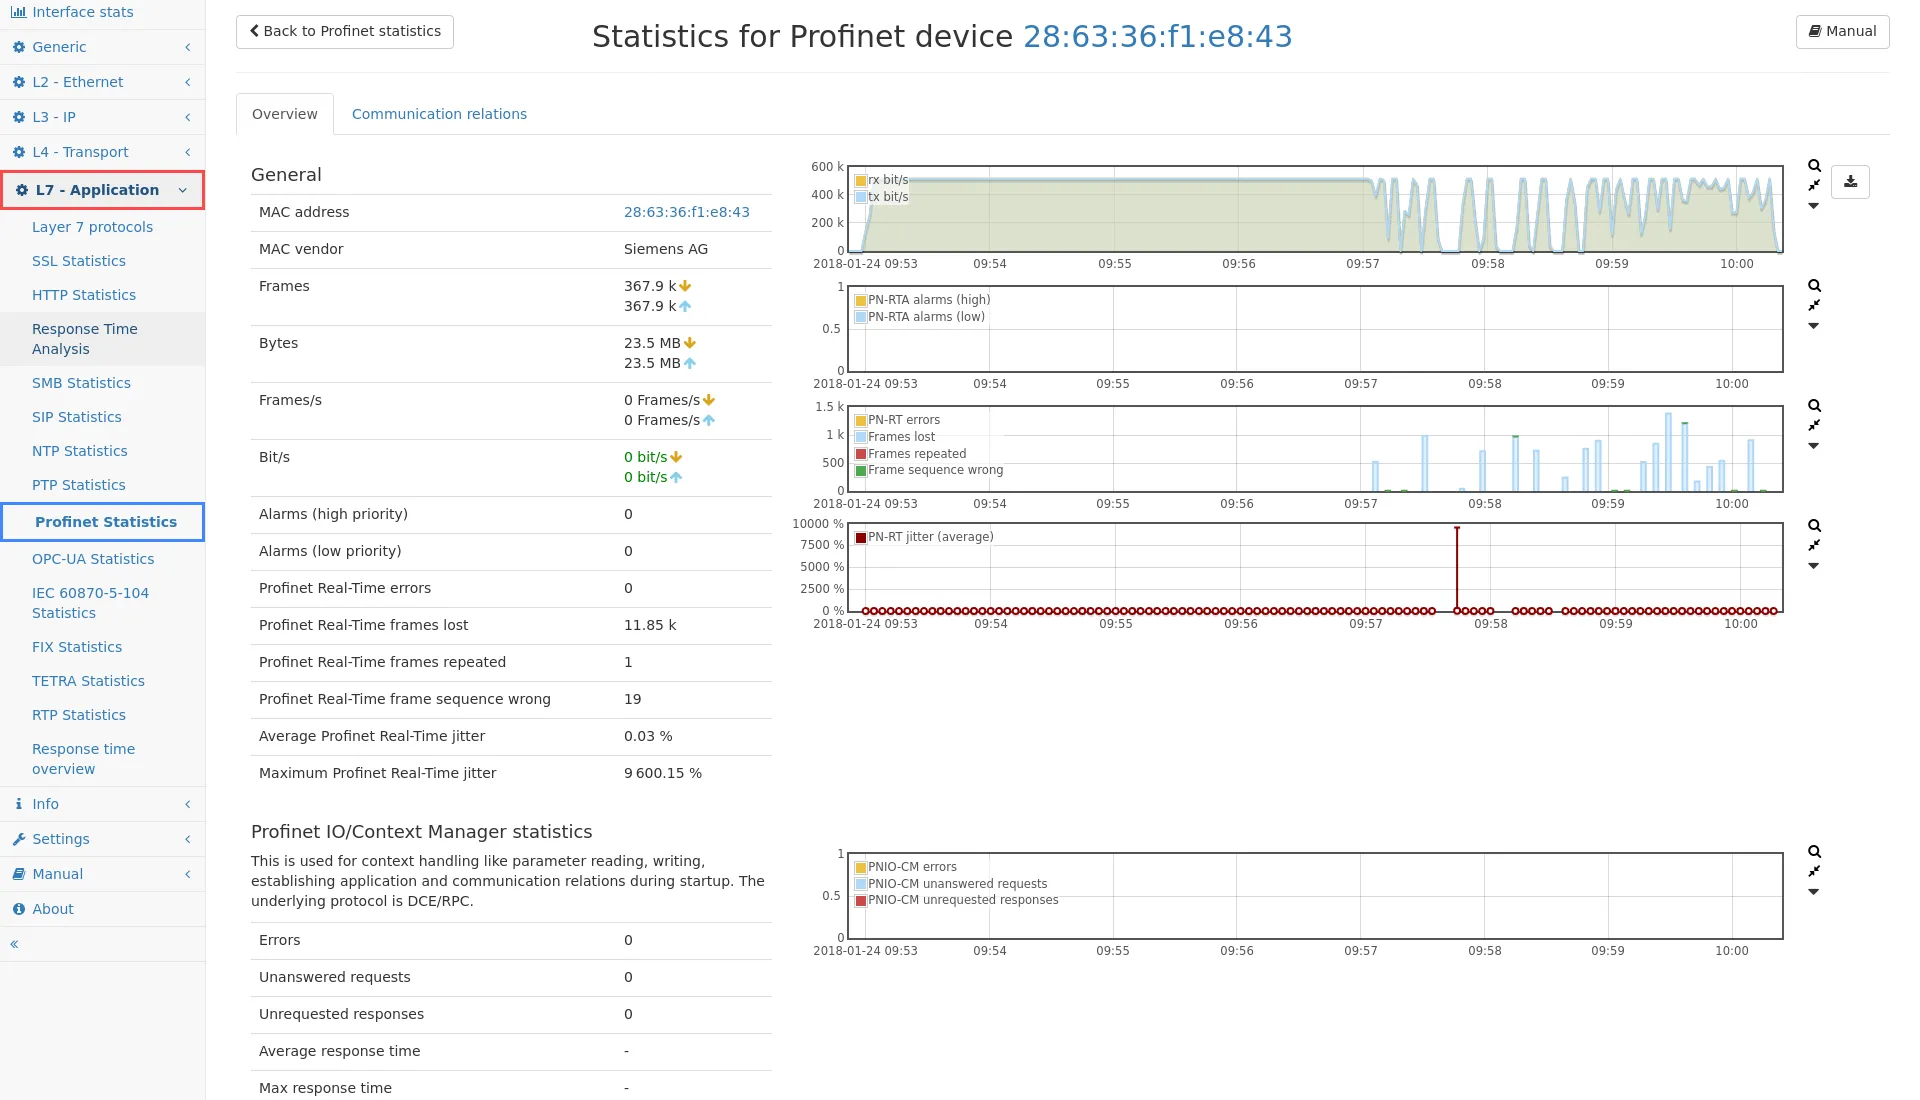
The (time interval) information for the PROFINET-device shown on this page includes:
- Total PROFINET bytes and frames count.
- Total PROFINET alarms and errors count.
- Average and maximum PROFINET jitter.
- PROFINET unanswered request count.
- PROFINET unrequested response count.
- PROFINET response time information.
Whenever graphs depict anomalies such as high loads, RT-errors, alarms and/or high jitter, these instances can be zoomed into by selecting a spike in the graph with the mouse (click and drag). This not only helps narrow down the timeframe to troubleshoot, it also results in the most optimized pre-filtered PCAP files with PROFINET traffic, if those are needed.
Communication relations
Section titled “Communication relations”The Communication relations tab on the Statistics for PROFINET device page shows all communication relations for a specific device. All communication relations, where the device took part either as a sender or receiver, are listed here. This page consists of the following tabs:
PROFINET Real-Time (PN-RT)
Section titled “PROFINET Real-Time (PN-RT)”This tab lists all PROFINET Cyclic RT frames and groups them by frame ID. Also, both a column and graph depict all errors extracted from the data and transfer status of each frame. Based on the cycle counter, frame loss, repeated frames and wrong frame sequence are indicated. You can sort all data and statistics displayed in the columns, for instance to quickly find the communication relation generating the highest jitter, most errors or most traffic.
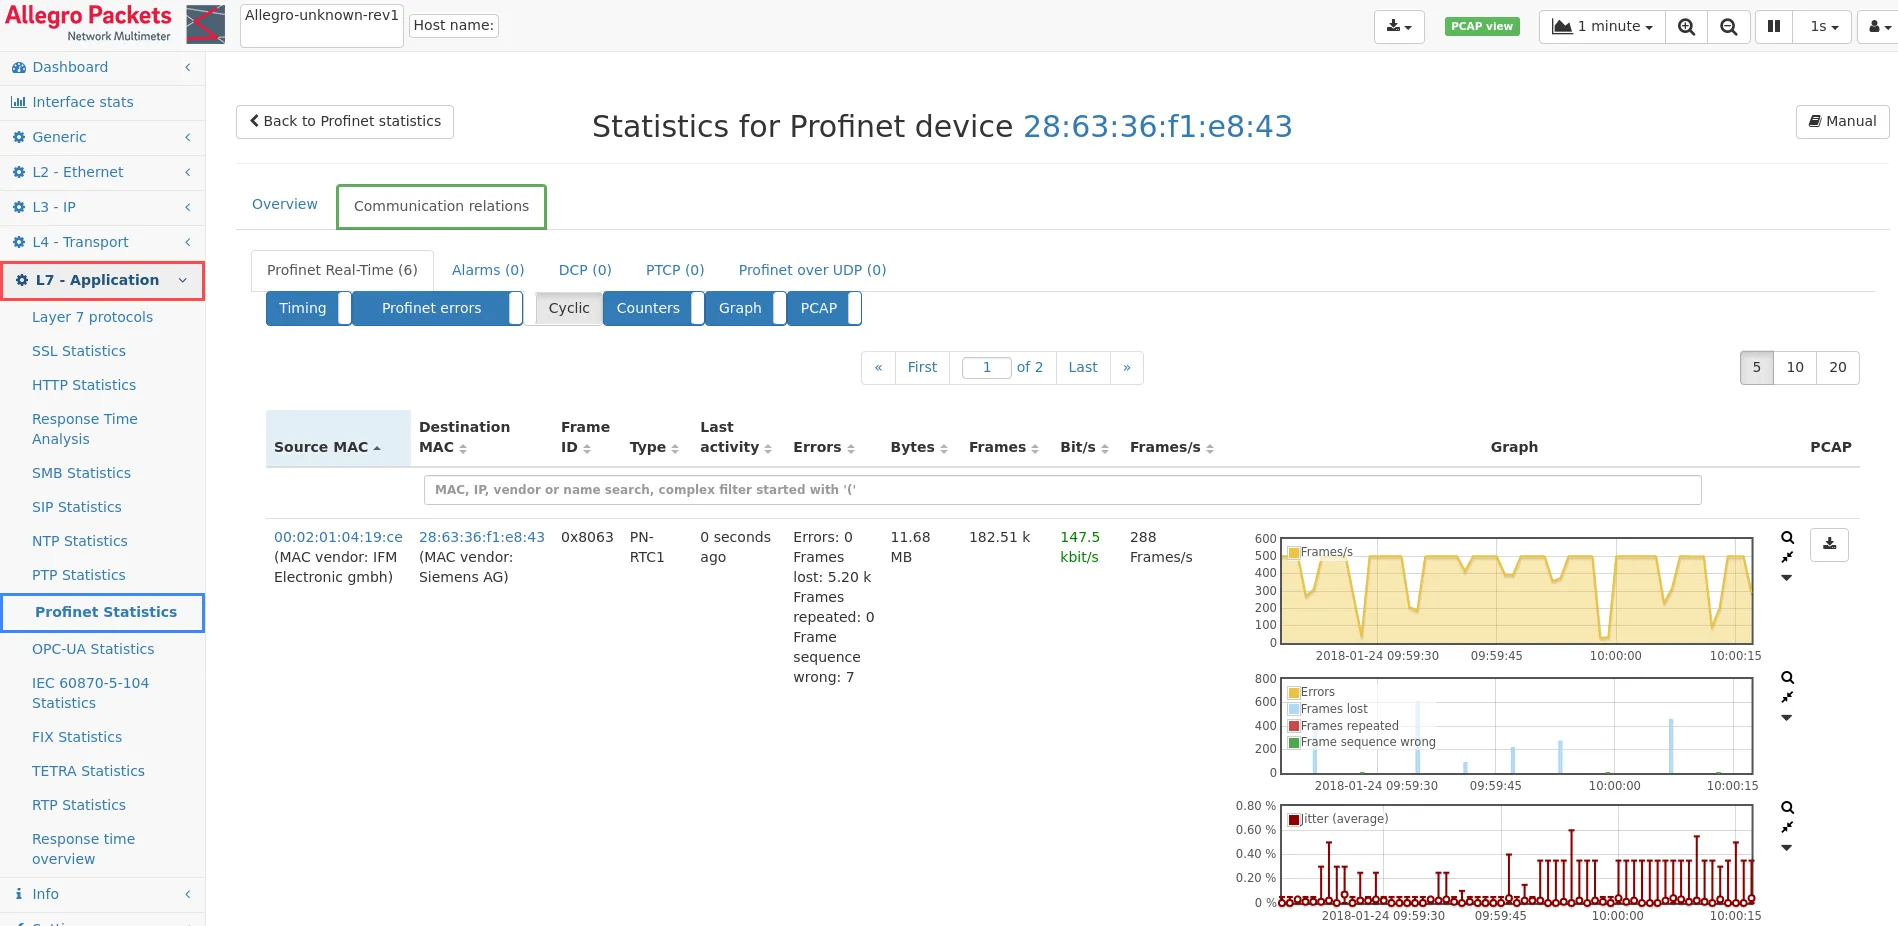
For PROFINET Cyclic frames, a jitter calculation is performed. The calculation is based on the increment of the cycle counter of two subsequent frames and the timestamps of these two frames as seen by the Allegro Network Multimeter. An error field shows the number of all responses with an error status, the number of not answered requests and the number of responses without a request.
The search bar allows to enter MAC, IP or vendor name to easily filter
and depict only the elements matching your search criteria. Also complex
filter expressions may be used in the search bar. Such complex filter is
initiated by starting a search string with an open parenthesis (.
See Live filtering of
tables for a
detailed description about how to use this feature.
Whenever graphs depict anomalies, such as high loads, RT-errors, alarms and/or high jitter, these instances can be zoomed into by selecting a spike in the graph with the mouse (click and drag). This not only helps narrow down the timeframe to troubleshoot, it also results in the most optimized pre-filtered PCAP files with PROFINET traffic per MAC/IP, if those are needed.
The download buttons on the far right provide you with such a pre-filtered PCAP. It will only contain the conversations from that specific IP/MAC during the selected time interval. Both, forward capturing in real-time, as well as retroactive packet extraction from an active ring buffer, are possible.
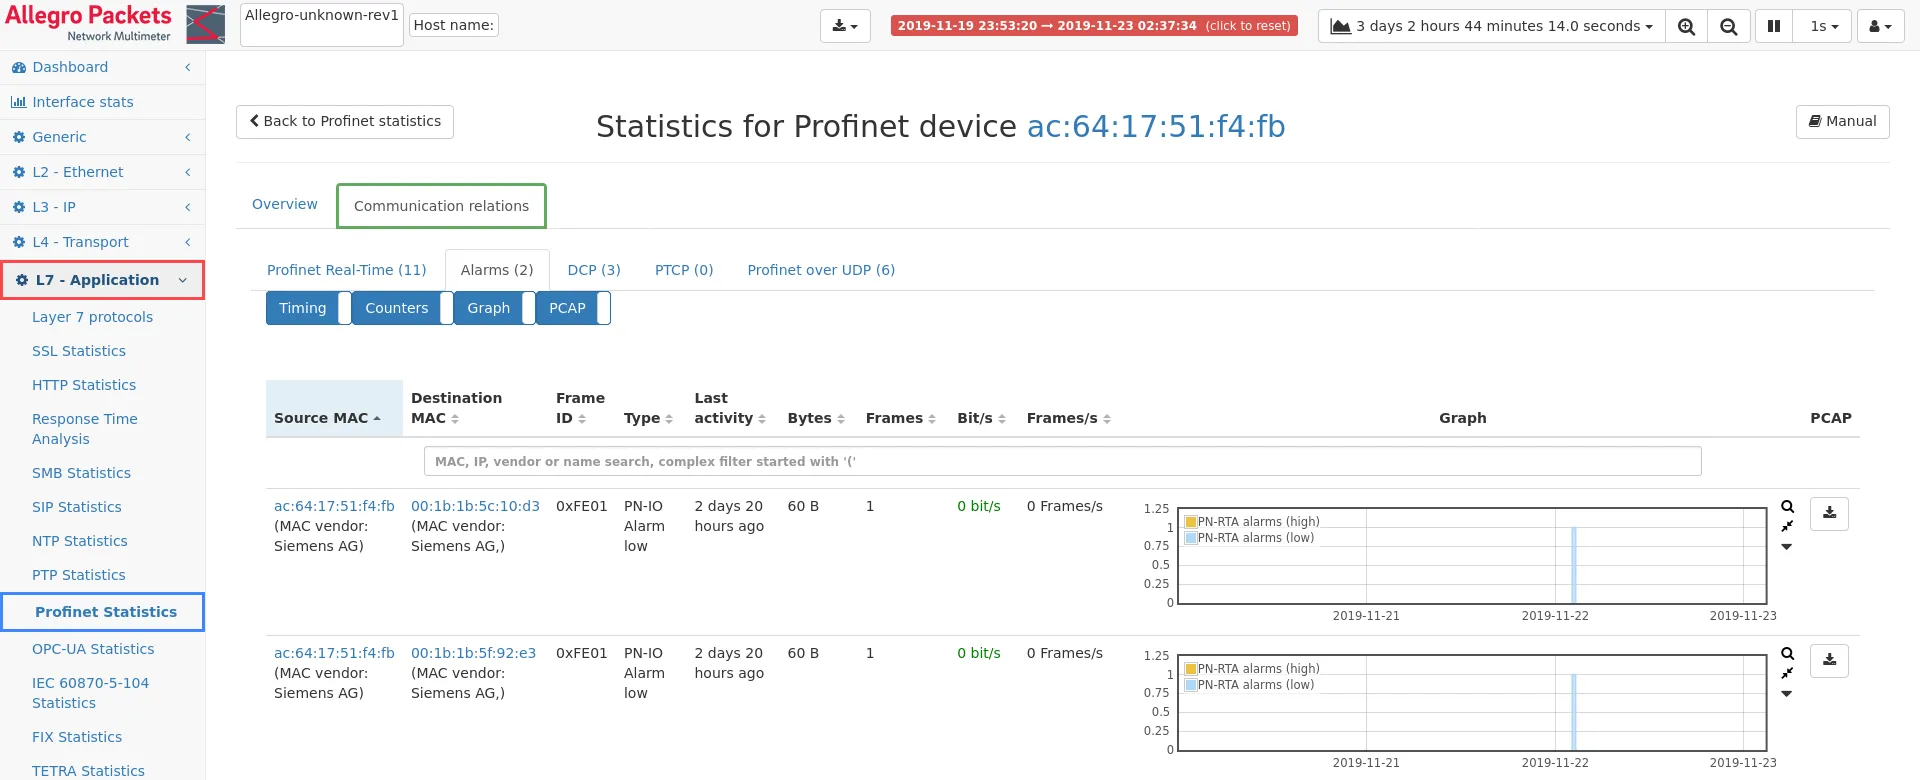
Alarms (PN-RTA)
Section titled “Alarms (PN-RTA)”This tab lists all PROFINET alarms. Both the high and low priority PROFINET alarms are listed here. You can sort all data and statistics displayed in the columns, for instance to quickly find the communication relation generating the most errors or most traffic.
The search bar allows to enter MAC, IP or vendor name to easily filter
and depict only the elements matching your search criteria. Also complex
filter expressions may be used in the search bar. Such complex filter is
initiated by starting a search string with an open parenthesis (.
See Live filtering of
tables for a
detailed description about how to use this feature.
Whenever graphs depict anomalies such as high loads, RT-errors, alarms and/or high jitter, these instances can be zoomed into by selecting a spike in the graph with the mouse (click and drag). This not only helps narrow down the timeframe to troubleshoot, it also results in the most optimized pre-filtered PCAP files with PROFINET traffic per MAC/IP, if those are needed.
The download buttons on the far right provide you with such a pre-filtered PCAP. It will only contain the conversations from that specific IP/MAC during the selected time interval. Both, forward capturing in real-time, as well as retroactive packet extraction from an active ring buffer, are possible.
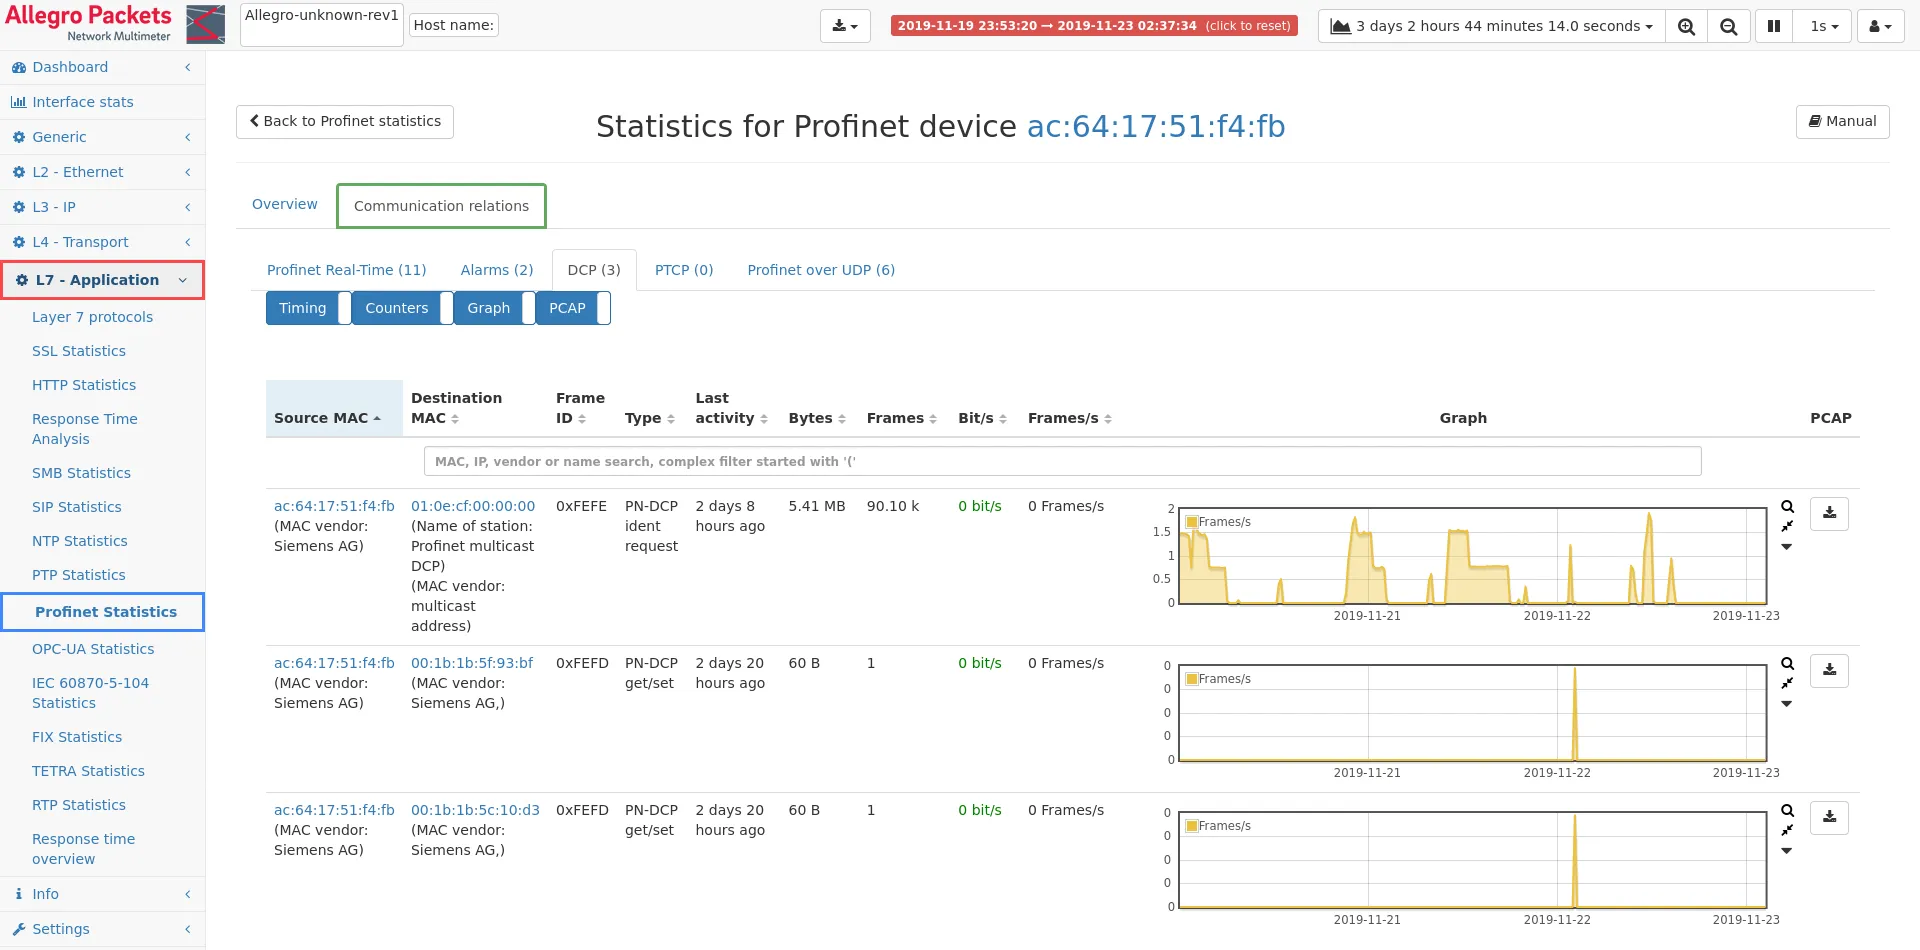
This tab lists all PROFINET DCP (Discovery and Configuration Protocol) frames that were sent from or sent to this device. DCP is used to configure station names and IP addresses. You can sort all data and statistics displayed in the columns, for instance by Frame ID, activity or most traffic.
The search bar allows to enter MAC, IP or vendor name to easily filter
and depict only the elements matching your search criteria. Also complex
filter expressions may be used in the search bar. Such complex filter is
initiated by starting a search string with an open parenthesis (.
See Live filtering of
tables for a
detailed description about how to use this feature.
Whenever graphs depict spikes in frame count that you want to investigate further, simply selecting a spike in the graph with the mouse (click and drag) makes the Allegro UI zoom into that specific time frame. This not only helps narrow down the timeframe to troubleshoot, it also results in the most optimized pre-filtered PCAP files with PROFINET for the conversation, if those are needed.
The download buttons on the far right provide you with such a pre-filtered PCAP. It will only contain the conversation from that specific IP/MAC during the selected time interval. Both forward capturing in real-time as well as retroactive packet extraction from an active ring buffer are possible.
This tab lists all PROFINET PTCP (Precision Transparent Clock Protocol) frames that were sent from or sent to this device. PTCP is used for time synchronisation.
Profinet over UDP
Section titled “Profinet over UDP”This tab lists all PROFINET Acyclic CM (Context Manager) frames that where sent over UDP from or to this device. The protocol is used during startup for the creation of application and communication relations, and allows for acyclic write and read requests between two PROFINET devices.
For PROFINET Acyclic requests in the scope of CM, Response Time Analysis between a request and a response is depicted as seen by the Allegro Network Multimeter.
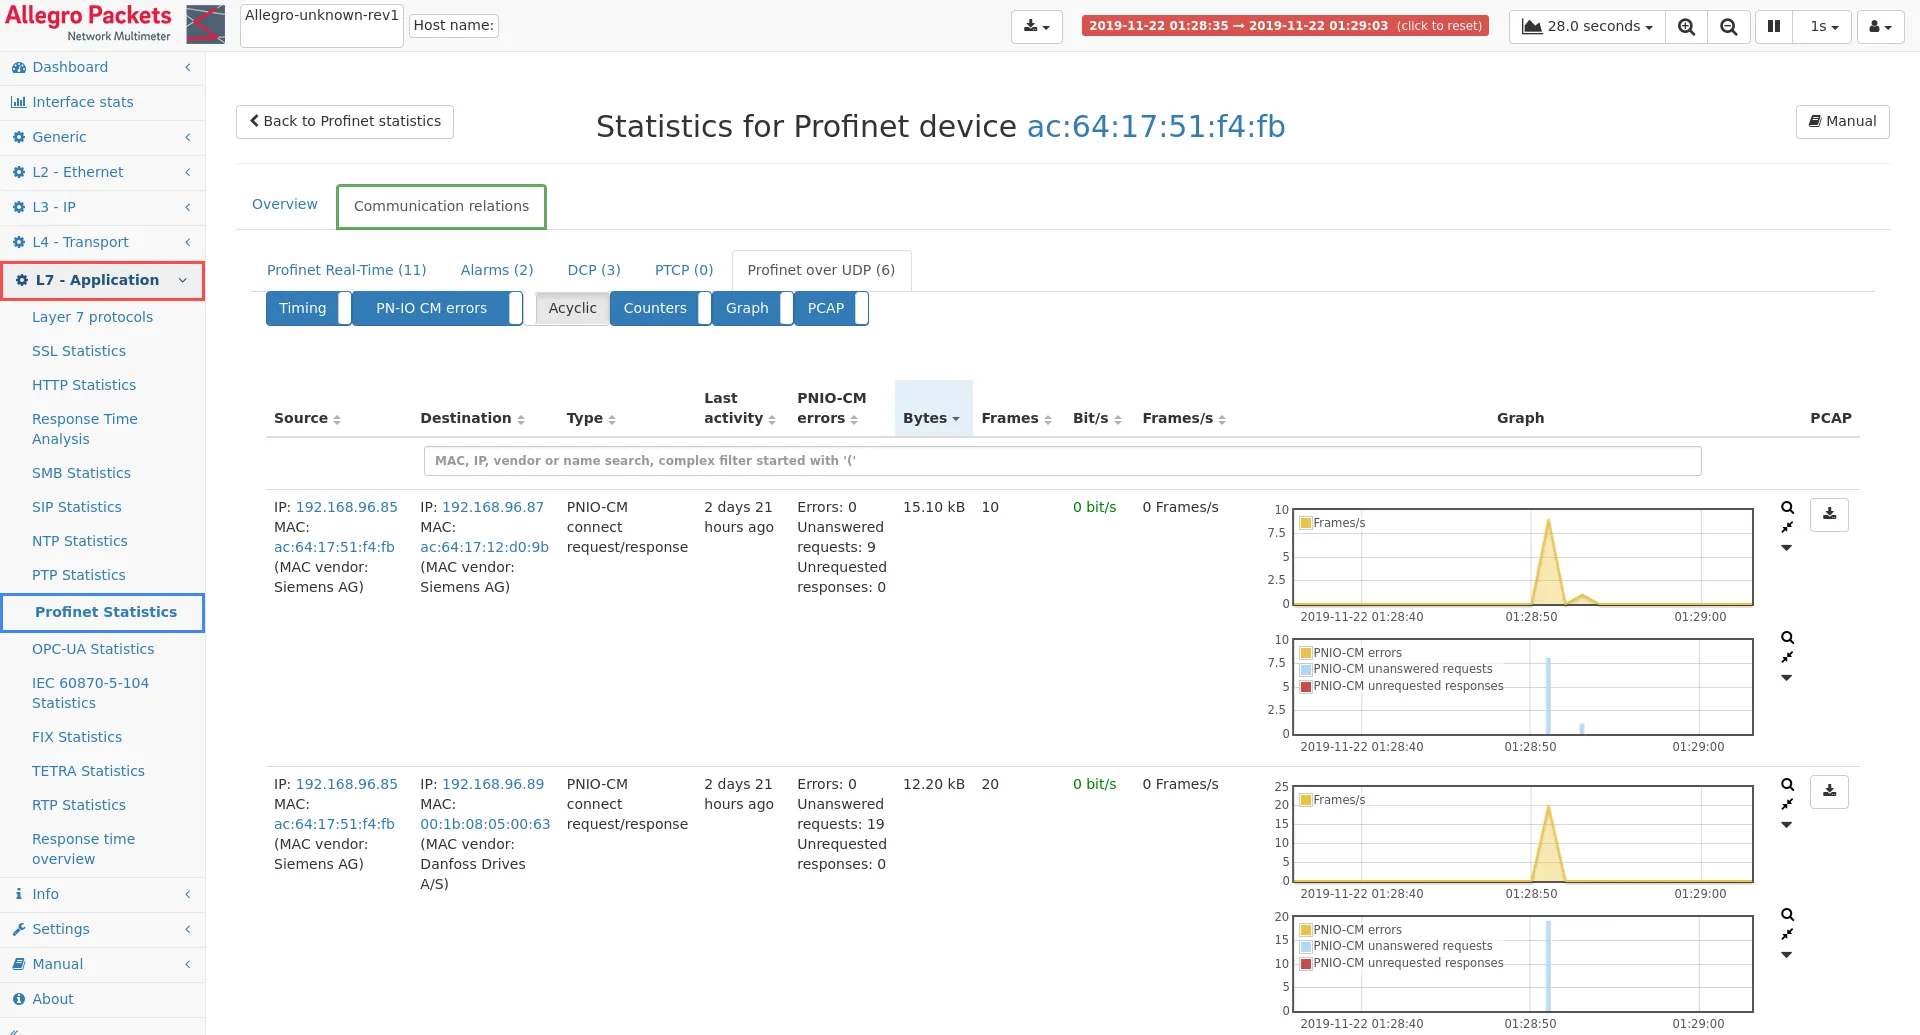
You can sort all data and statistics displayed in the columns, for instance to quickly find the communication relation generating the highest response times, most errors or most traffic.
The search bar allows to enter MAC, IP or vendor name to easily filter
and depict only the elements matching your search criteria. Also complex
filter expressions may be used in the search bar. Such complex filter is
initiated by starting a search string with an open parenthesis (.
See Live filtering of
tables for a
detailed description about how to use this feature.
Whenever graphs depict spikes in frame count that you want to investigate further, simply selecting a spike in the graph with the mouse (click and drag) makes the Allegro UI zoom into that specific time frame. This not only helps narrow down the timeframe to troubleshoot, it also results in the most optimized pre-filtered PCAP files with PROFINET for the conversation, if those are needed.
The download buttons on the far right, provide you with such a pre-filtered PCAP. It will only contain the conversation from that specific IP/MAC during the selected time interval. Both, forward capturing in real-time, as well as retroactive packet extraction from an active ring buffer, are possible.