Edge Visibility
The Edge Visibility feature can be used to analyze traffic recorded by an Edge Visibility Agent installed on a remote Windows machine. This page explains how to get started with the feature and how to perform analyses.
The Edge Visibility Agent is an application for Microsoft Windows 10/11 and Microsoft Windows Server 2016 and newer. It consists of a service which captures network traffic into a ringbuffer on the Windows machine and connects to a Allegro Network Multimeter. From the multimeter one can then request PCAP downloads from the agent’s ringbuffer for analysis on the multimeter.
A controlpanel application is provided alongside the capture service which can be used to monitor and configure the local ringbuffer.
For environments where an installation is undesirable we also provide a CLI version of the Edge Visibility Agent which can be downloaded and used without installation. It requires administrator privileges on the target machine and runs in the foreground instead of as a service. See CLI for more information.
Installation
Section titled “Installation”Download and install the EdgeVisibilityAgent installer. The download link is located under Generic > Edge Visibility > Downloads. This will install the capture service and controlpanel application, which allows regular users on the Windows machine to perform network captures. Users will have to be granted permissions to the capture service explicitly.
In order to allow an ordinary Window user on the machine to use the agent you must grant them access to the capture service. This can be done automatically by starting the control panel application as a user. The application will ask if you want to set up the current user account. This action requires administrator privileges.
The subsequent dialog allows a user to add an initial configuration to the service. These configurations are:
- Remote Allegro Network Multimeter hostname (URL of the web interface)
- Port used to connect to the Multimeter (default is the HTTPS port 443)
- API Token to authenticate the current user (see Granting access to users below)
- Desktop notifications (see User confirmation)
- Autostart
These fields can be left empty. After setting up the user, the controlpanel will start normally.
Alternatively, the tool can also be used from the commandline (see CLI)
Using the agent
Section titled “Using the agent”The agent is used via the controlpanel application that comes as a part of the default installation. By default, a shortcut to the controlpanel will be created on the desktop. Starting the capture service by any other means (for example via the Windows Services application) will not work.
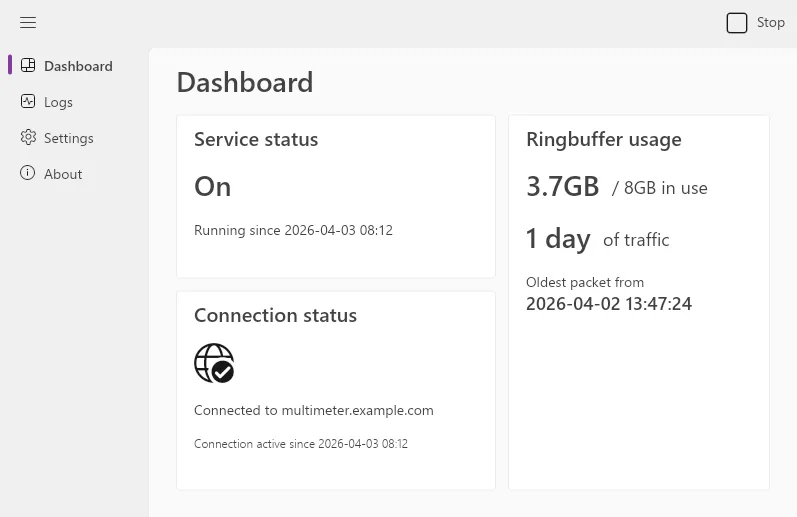
In the controlpanel, the service can be started and stopped via the button in the top right of the application.
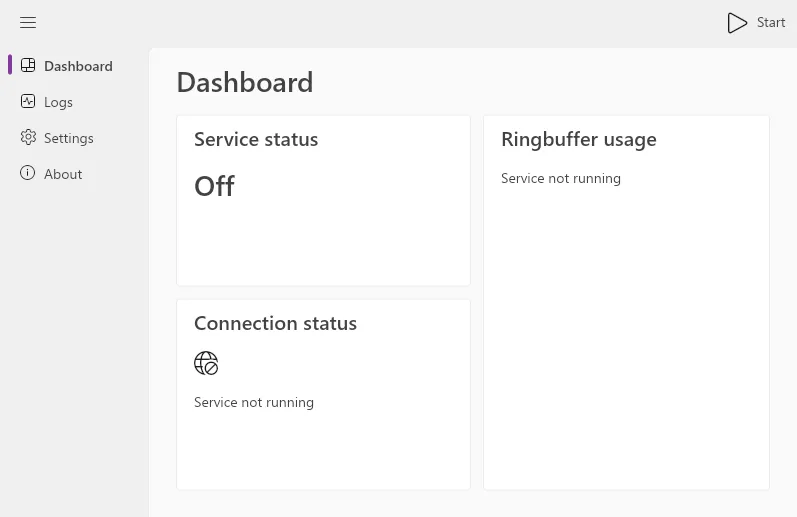
Service
Section titled “Service”The service page gives a quick overview of the current status of the capture. If the service is running, the dashboard will display stats about the service and connection to the multimeter, as well as information about ringbuffer usage.
The logs page provides informational messages, warnings, and errors generated by the capture service, as well as the controlpanel application itself. The logs are loaded once when the page is opened, and are only updated with a click on the “Reload” button in the top right.
An “Export” button is provided in order to export both logs into a zip file.
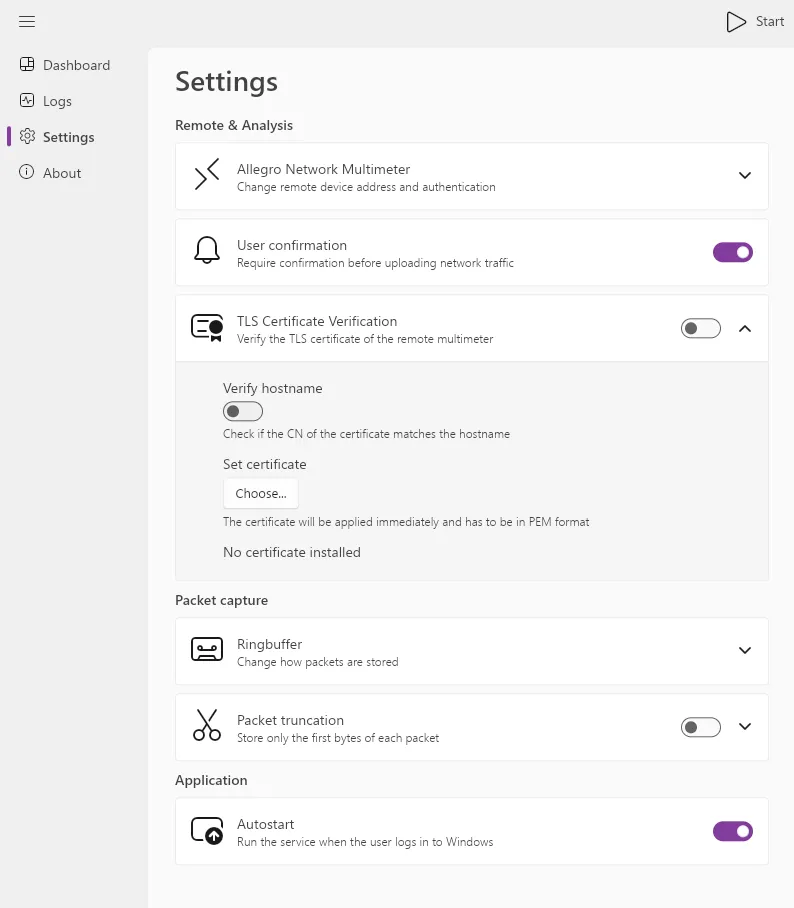
Settings
Section titled “Settings”On this page, all aspects of the capture service can be configured. Most importantly, this is where you can change the multimeter the service connects to, as well as the ringbuffer settings.
Allegro Network Multimeter
Section titled “Allegro Network Multimeter”Hostname, port and API token to the remote multimeter can be changed here. For the hostname, either the local DNS name, a remote service URL, or an IP can be used. The agent needs to have access to the management interface.
The port is the default HTTPS port over which web requests are made.
API tokens can be generated on the multimeter (see Granting access to agents for more information.
User confirmation
Section titled “User confirmation”Enable or disable user notifications on traffic downloads. When the multimeter requests an analysis of the contents of an agent’s ringbuffer, the service will present the user with a desktop notification where they can either accept or decline the analysis. Disabling this setting will disable these notifications.
Note that regardless of this setting, all accesses to the ringbuffer by a multimeter will be logged on the client.
SSL Certificate Verification
Section titled “SSL Certificate Verification”When disabled, the capture service will not verify the remote multimeter’s SSL certificate. The connection will still be encrypted, but any certificate installed on the remote will be accepted. This setting needs to be set to off if the default SSL certificate is used on the Allegro Network Multimeter.
If certificate verification is desired, a custom certificate will have to be installed to the multimeter, and the certificate needs to be provided via this setting. Alternatively, the certificate’s root CA can also be installed to the Windows machine directly.
Hostname verification can be disabled separately as well.
Ringbuffer
Section titled “Ringbuffer”These settings control the size and location of the ringbuffer on disk. By default, the ringbuffer will be stored in the
user’s Temp folder (%TEMP%).
A one-size-fits-all recommendation for ringbuffer sizes cannot be given, as the timespan of traffic that fits in the buffer depends on the traffic density and activity of the client. An inactive client might be able to store days worth of traffic in a ringbuffer of only a couple gigabytes, whereas a client performing frequent up- or downloads of large files might fill up the same buffer in minutes.
Packet truncation
Section titled “Packet truncation”This setting controls how much data of each packet should be kept in the ringbuffer. When disabled, the whole packet is stored.
Autostart
Section titled “Autostart”Whether the application should be started on user login. Note that Windows makes no guarantees that applications in autostart are launched immediately after login. It might take a short while for applications to be started.
Configuring the Multimeter
Section titled “Configuring the Multimeter”Once the Multimeter firmware containing the Edge Visibility feature is installed, configuring and using it is straightforward. The Multimeter will be continuously listening for incoming connections from an agent. Only connections from agents with a valid authentication token will be accepted.
Connected clients are shown under Generic > Edge Visibility, in the Agents tab. Tokens are created on the same page under the Manage tab.
Granting and revoking access to agents
Section titled “Granting and revoking access to agents”Generate a new token under Generic > Edge Visibility > Manage by clicking the ‘Create Token’ button. The subsequent dialog will ask for a name for the token and an expiration date (optional). After you click Create, take note of the string shown on screen, as it won’t be shown again after closing the dialog. This string is the access token required by the agent.
This page also shows all tokens that have been created in the past, as well as an option to delete individual tokens. When a token is deleted, it will stop working.
Roles and Permissions
Section titled “Roles and Permissions”This firmware also introduces new user permissions.
| Resource | Read | Update | Delete |
|---|---|---|---|
ev-agent-management | Can see connected agents | Can analyze agent ringbuffers | - |
ev-token-management | Can see tokens | Can create tokens for agents | Can revoke tokens for agents |
The functionality of the capture service can also be used from the command line. Admin privileges are required in order
to perform a network capture. The CLI tool is provided alongside the download of the MSI file and is called
eva-cli.exe.
To get a quick overview of the available options, you can run .\eva-cli.exe --help.
The possible configuration options for the CLI are identical to the settings provided in the controlpanel. On top of that, the following additional options are provided:
| Flag | Explanation |
|---|---|
-c, --config | Provide a list of settings in TOML format (see Config file) |
-l, --log-level | Changes how detailed the log outputs are. default shows informational messages, warnings and errors. debug provides additional messages useful for debugging. |
-e, --etl-replay | Allows you to replace the ringbuffer with a pre-captured ETL file instead. This is useful if you captured network traffic via other means and want to use the agent in order to provide that data to a multimeter |
-p, --pcap-out | When an analysis is requested from the multimeter, the data will not be sent over the network, but written to a PCAP file instead |
Config file
Section titled “Config file”A config file can be provided in TOML format. This is an example configuration using all available settings:
# hostname = "allegro-mm-2119"hostname = "allegro-mm-f913"port = 443api-key = "....."
log-file-path = "C:\\....." # don't forget to escape backslashesringbuffer-size = 4096 # 4096MB = 4GBpacket-truncation = 128
ssl-verify-cert = truessl-verify-hostname = falsessl-cert = "C:/path/to/cert.pem" # forward slashes are also possible
If you omit a setting from the TOML file, a default value will be used instead. When providing explicit config options
via the CLI (like --hostname, --ssl-cert, …), the values in the config will be overridden by the values passed as
arguments.
Default CLI settings
Section titled “Default CLI settings”| Setting | Default value |
|---|---|
| Hostname | "" (empty string) |
| Port | 443 |
| API Token | "" (empty string) |
| Ringbuffer location | %TEMP% |
| Ringbuffer size | 1GB |
| Packet truncation | No truncation (0) |
| SSL certificate verification | Enabled |
| SSL hostname verification | Enabled |
| SSL certificate | None |
Performing an analysis
Section titled “Performing an analysis”When an agent successfully connects to the multimeter it will be displayed in the agents list under Generic > Edge Visibility > Agents. Each agent will show up with the name of the machine it’s running on and the name of the logged-in user.
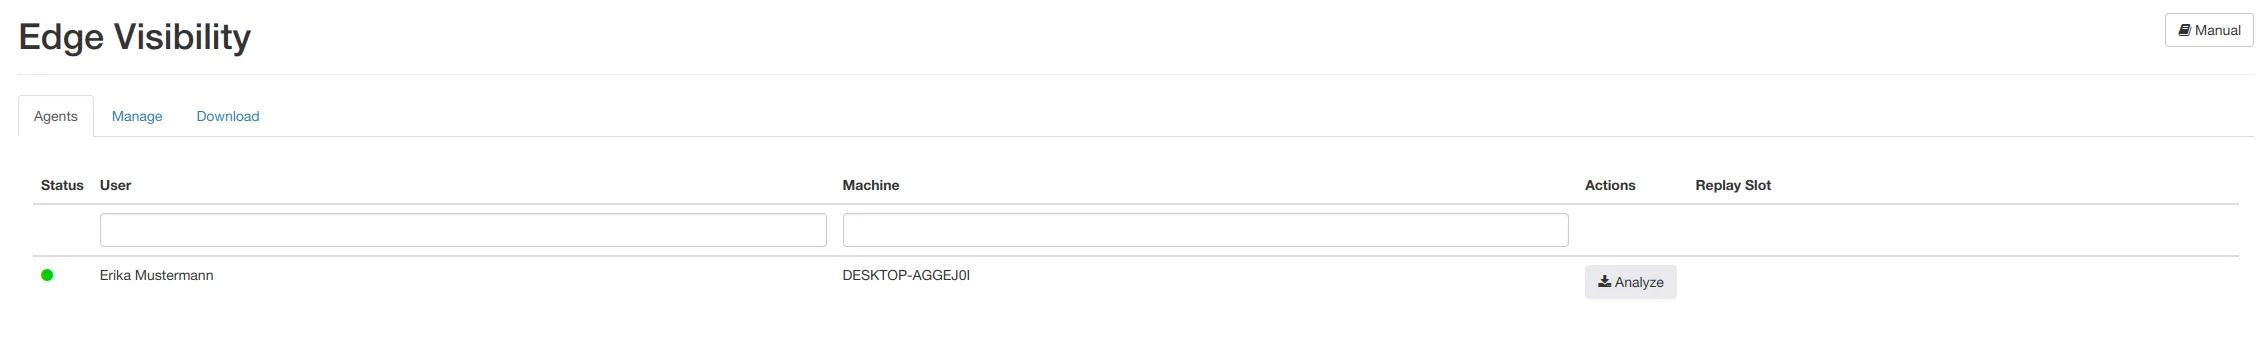
Clicking the “Analyze” button next to a connected client will open a dialog where several aspects of the analysis can be configured:
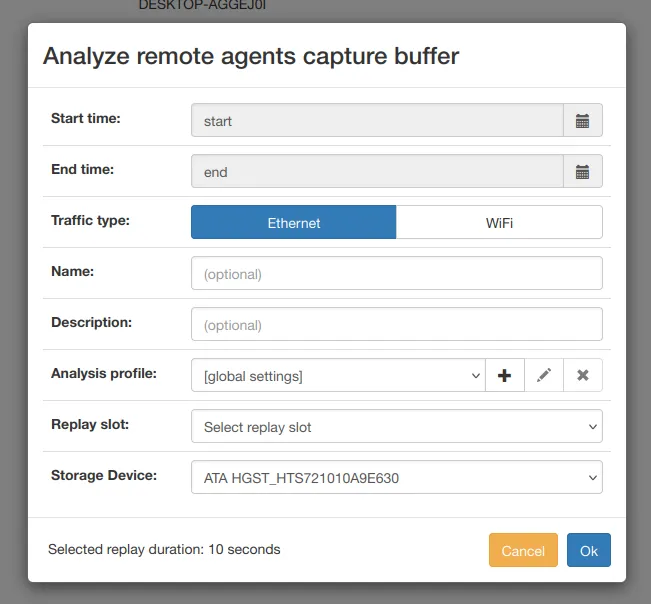
| Setting | Meaning |
|---|---|
| Start/End time | Select the timeframe of the packets you want to extract. These values will automatically be set to the agent’s ringbuffer start and end points by default. |
| Traffic type | Select whether you want to extract Ethernet or WiFi traffic from the ringbuffer. Due to a technical limitation it is currently not possible to extract both at the same time |
| Name (optional) | Optional name to give to the replay slot |
| Description (option) | Option description to associate with the replay slot |
| Analysis profile | Apply an analysis profile to the PCAP analysis |
| Replay slot | Select the replay slot where the analysis should be performed in |
| Storage Device | Select whether you want to use a replay packet buffer, and if so on which disk you want to create it |
By clicking “Ok” in the lower right corner of the modal, an analysis request will be sent to the client.
From this point on the behaviour is identical to a regular PCAP upload. After the upload finishes a modal will appear that asks whether you want to switch to the replay slot in use. The analysis can be finished the same way you would finish a PCAP replay.